
Abstract
Aim
The Quadriceps angle (Q angle) is used for the prediction, diagnosis, and follow-up of pathologies of knee joint. It gives information about the direction and size of forces applied to the patella. It is described as the angle formed by lines drawn from anterior superior iliac spine to the midpoint of the patella, and from the midpoint of the patella to tibial tuberosity. It gives information about the alignment of anatomical structures of the knee joint. We aimed to investigate the effects of Q angle upon gait and static balance.
Materials and Methods
A sample of 106 female and 105 male healthy subjects at age 18-25 years participated in our study. After notting their height and weight, bilateral Q angles were measured with goniometer in standing and supine positions. The force platform Zebris© FDM System Type FDM 1.5 and the WinFDM computer program were used for the gait and stance analysis. SPSS 20 program was used for statistical analysis of the obtained data. Statistical significance limit was determined as p<0.05.
Results
We assessed that there was no significant relationship between Q angle and gait analysis parameters. We observed that some of ground reaction force parameters and the butterfly diagram parameters obtained through the gait analysis as well as some of the stance analysis parameters were weak or moderately related to the Q angle. Parameters related to the Q angle did not show a pattern that would be classified by the Q angle measurement method or by the side or by the gender.
Conclusion
We think that it is necessary to conduct more extensive research in order to clarify the relationship between Q angle and walking pattern. We suggest that our research will contribute to the literature as a pioneering study in terms of the relationship between the Q angle and gait analysis as well as the stance analysis.
Keywords: Quadriceps angle, Q angle, gait analysis
INTRODUCTION
The narrow angle formed between the line passing through the spina iliaca anterior superior (SIAS) and the midpoint of the patella and the line passing through the tibial tuberosity and the midpoint of the patella is called the Quadriceps angle (Q angle) (), . Q angle represents the angle between the forces acting on the patella from proximal and distal directions and expresses the direction of the extension force applied to the patellar tendon, , , .
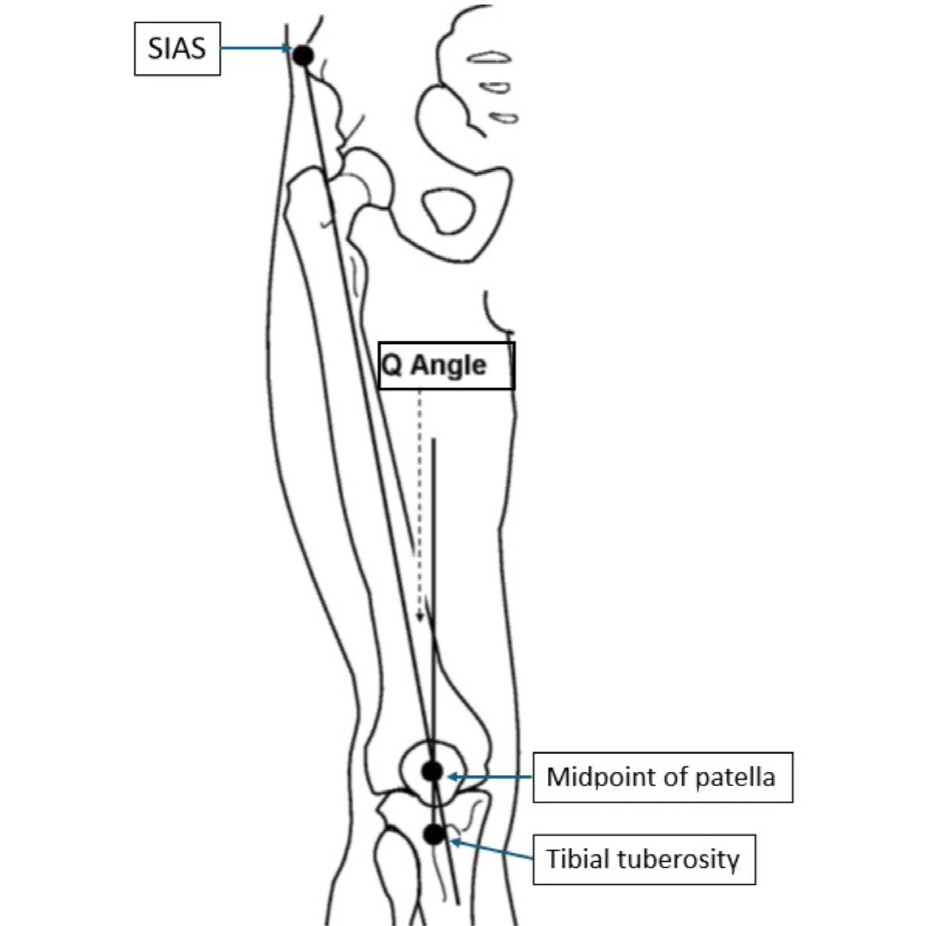
SIAS: Spina iliaca anterior superior, Q angle: Quadriceps angle
The normal value range of the Q angle was found to be 10.14° in men and 15-23° in women. It has been said that differences in angle may be related to height and muscle strength-. Additionally, the Q angle is affected by the measurement position; values measured in the supine position were found to be 0.2-1.3° lower than those measured in the standing position-. In addition, contraction of the quadriceps femoris muscle during knee extension causes an increase in the Q angle by shifting the patella laterally, while when the knee is flexed, the Q angle decreases with the internal rotation of the tibia, , . It is known that the position of the foot during measurement also affects the Q angle.
Increasing Q angle increases the pressure on the patellofemoral joint by increasing the lateral traction force applied to the patella-. Over time, this condition can cause patellofemoral pain and joint cartilage degeneration-.
However, the patellofemoral joint is an important part of knee joint biomechanics during walking. We think that keeping the patella in the correct position during knee extension and flexion may play an important role in the coordination of leg movements and the effective transfer of the forces produced by the lower extremity. The effect of this situation on walking can be examined using the gait analysis method because gait analysis offers the opportunity to objectively evaluate gait cycles using various measurement systems-.
This study aims to fill an important gap in the existing literature by providing a detailed examination of the effect of the Q angle on walking mechanics. Studies to date have focused on static measurements of the Q angle and its relationship with patellofemoral pain or knee joint biomechanics, , . However, how the Q angle changes in dynamic processes, especially during walking, and the effects of these changes in different phases of the gait cycle have not been adequately investigated. By combining static Q angle measurements with dynamic gait analysis, this study may offer a new perspective in clinical evaluation and treatment protocols. In this way, the usability of Q angle measurement in the early diagnosis of individuals’ gait disorders or knee joint pathologies can be increased.
MATERIALS AND METHODS
The number of volunteers to participate in the study was set as at least 86 for each group using the G*Power program (effect size: 0.5, alpha: 0.05, power: 0.9). A total of 211 healthy volunteers, including 105 men and 106 women between the ages of 18 and 25 years, participated in our study. The Ethics Committee approved this cross-sectional study for Scientific Research of the Faculty of Medicine of Trakya University, in accordance with the Declaration of Helsinki (decision no: 04/03, date: 01.03.2017). Those with acute or chronic diseases affecting the locomotor system were not included in the study. The same researcher recorded all measurements at the same time of the day (15:00-17:00). Volunteers were informed and then, their consent was obtained. Q angle was measured in standing and supine positions. While the subjects were standing, in an upright position and with their feet in neutral position, the SIAS, patella midpoint and tuberositas tibiae were marked by palpation, and the narrow angle between the lines passing through these points was measured with a goniometer. During the measurement, the subjects were asked not to contract their quadriceps femoris muscle. Measurements were repeated three times with two-minute intervals for both sides and the average value was recorded. When measuring while standing, the fingertips were ensured to point straight ahead, and passive support was given to prevent foot rotation when measuring in the supine position.
Force platform Zebris©, FDM System Type FDM 1.5 and WinFDM computer program were used to determine the walking pattern. Volunteers were asked to walk at their normal walking speed while standing upright, with their eyes open, their head facing straight ahead, and their arms swinging freely at either side of the body. Gait analysis was repeated three times for each subject and average values were recorded. Data obtained through gait analysis were evaluated under the headings of time, space, time-phase and space-time, . The parameters obtained as a result of gait analysis and used in our study are explained in .
Table 1. Parameters obtained by gait analysis20
Time parameters | Step time (sec) | It is the time from the first contact of the foot on one side to the first contact of the foot with the ground on the other side. It is expressed as right step time and left step time. |
|---|---|---|
Double step time (sec) | It is the time between the first two consecutive ground contacts of the foot on the same side. | |
Space parameters | Stride length (cm) | It is the distance between the heels of two consecutive feet in the walking direction. The distance between two consecutive heels on the same side is called double stride length. A walking cycle includes steps on different sides that follow each other. |
Step width (cm) | It is the distance between the vertical axes of the two sides. Vertical axes pass through the middle of the talocrural joint or calcaneus. | |
Foot rotation (°) | It is the angle measured between the walking direction and the long axis of the foot. | |
Temporal/ spatial parameters | Walking speed (cm/sec) | It is obtained by dividing the distance walked by the walking time. Double stride length can also be calculated by multiplying by cadence and dividing by two. |
Cadence (tempo) (step/minute) | It is the total number of steps taken in one minute. | |
Time-phase parameters | Right-left stance (GC%) | The phase that begins with the first breaking of the heel of the foot onto the ground and continues until the toes of the same foot cease to contact the ground is called the stance phase. During a walking phase, weight is carried at this stage. The duration of this phase is referred to as the stopping time. |
Right-left loading (GC%) | It is the ratio of the time elapsed during the stance phase until the first double support phase begins to the gait cycle. | |
Before right-left swing (GC%) | It is the phase from the first contact of the heel of the foot on one side to the ground until the toes of the foot on the other side are lifted off the ground. | |
Right-left swing phase (%GC) | It is the ratio of the time between the time when the toes leave the ground and the time when the heel of the same foot first touches the ground, to the entire cycle. | |
Right-left single support (%GC) | It is the phase in which only the foot on one side touches the ground. It is the phase that lasts from the last contact of the foot on the other side with the ground until the next first contact of the toes of the same foot with the ground. | |
Total double support (%GC) | It is the sum of the two periods during which both feet touch the ground in a walking cycle. | |
Butterfly diagram parameters | Walking line length | When the ground contacts on both sides are examined separately, it is the average value of the line length showing the pressure centers of one side. It only shows the maximum peak pressure progression recorded in one side's steps. It is the only parameter that does not originate from the butterfly diagram screen. |
Single support line | It is the average length of the lines showing the progression of pressure by evaluating the entire contact of the soles of the feet with the ground. | |
Anteroposterior position | For all steps, it means that the intersection point of the pressure centers shifts forward and backward on the butterfly diagram screen. | |
Anteroposterior variability | It refers to the standard deviation value of the front-back position. |
GC: Gait cycle
Statistical Analysis
SPSS for Windows 20.0 was used to analyze the data obtained in the research. Since the Kolmogorov-Smirnov normality test showed that the data were in accordance with normal distribution, statistical analysis between groups was performed with the Student’s t-test and results were expressed as mean ± standard deviation. The Spearman’s rank correlation test was performed to compare the relationship between Q angle and gait and balance parameters. The Spearman’s rank correlation coefficient was evaluated as weakly correlated in the range of 0-0.24, moderately correlated in the range of 0.25-0.49, well correlated in the range of 0.50-0.74, and strongly correlated in the range of 0.75-1.00. A p-value<0.05 was considered statistically significant.
RESULTS
When the anthropometric data of the volunteers participating in our study were examined, it was seen that there was a significant difference (p<0.05) between the average height, body weight and body mass index of men and women, but there was no significant difference in the Q angle values. According to gait analysis data, among the parameters with a significant difference between genders, only the average value of cadence was higher in women ().
Table 2. Anthropometric data, quadriceps angle values and gait analysis parameters
Female (n=106) mean ± SD | Male (n=105) mean ± SD | p-value | ||
|---|---|---|---|---|
Anthropometric data | Age (years) | 19.23±1.34 | 19.38±1.42 | 0.418 |
Height (cm) | 164.62±5.64 | 179.19±5.96 | 0.0001* | |
Weight (kg) | 60.00±9.38 | 75.75±10.47 | 0.0001* | |
BMI (weight/heightx2) | 22.16±3.11 | 23.46±3.02 | 0.002* | |
Q angle values | Q supine R (°) | 15.14±2.36 | 15.17±2.44 | 0.932 |
Q supine L (°) | 15.05±2.20 | 14.70±2.43 | 0.223 | |
Q standing R (°) | 15.51±2.27 | 15.42±2.56 | 0.486 | |
Q standing L (°) | 15.37±2.21 | 15.02±2.52 | 0.184 | |
Gait analysis parameters | Left foot rotation (°) | 6.23±4.12 | 10.86±4.77 | 0.0001* |
Right foot rotation (°) | 7.54±3.62 | 13.00±4.59 | 0.0001* | |
Step width (cm) | 9.70±2.67 | 14.35±3.36 | 0.0001* | |
Left step length (cm) | 61.34±5.21 | 63.44±6.70 | 0.026* | |
Right step length (cm) | 61.43±5.24 | 64.07±6.37 | 0.003* | |
Double step length (cm) | 122.60±10.13 | 127.10±12.80 | 0.012* | |
Left step time (sec) | 0.86±0.35 | 0.94±0.23 | 0.041* | |
Right step time (sec) | 0.91±0.29 | 0.96±0.19 | 0.102 | |
Double step time (sec) | 1.00±0.00 | 2.27±12.98 | 0.315 | |
Left press phase (%) | 62.50±1.73 | 62.84±1.52 | 0.107 | |
Right press phase (%) | 63.33±1.50 | 63.07±1.58 | 0.295 | |
Left loading (%) | 12.92±1.33 | 12.85±1.47 | 0.823 | |
Right loading (%) | 12.62±1.66 | 12.63±1.45 | 0.617 | |
Left single support (%) | 36.97±1.56 | 37.36±1.59 | 0.120 | |
Right single support (%) | 37.70±1.69 | 37.50±1.54 | 0.218 | |
Before left swing (%) | 37.50±1.73 | 37.16±1.52 | 0.107 | |
Before right swing (%) | 36.70±1.50 | 36.73±2.59 | 0.402 | |
Total double support (%) | 25.71±3.94 | 25.25±2.75 | 0.868 | |
Cadence (steps/minute) | 54.89±3.59 | 51.95±4.13 | 0.0001* | |
Speed (km/h) | 3.96±0.55 | 3.96±0.68 | 0.815 | |
GRF parameters | F1 max R (N) | 604.60±112.70 | 768.53±147.94 | 0.0001* |
F1 max L (N) | 628.93±112.90 | 800.10±148.33 | 0.0001* | |
F2 max R (N) | 652.54±112.05 | 811.36±129.19 | 0.0001* | |
F2 max L (N) | 666.26±107.49 | 824.82±127.17 | 0.0001* | |
T1 max R(sec) | 0.19±0.07 | 0.20±0.051 | 0.3920 | |
T1 max L (sec) | 0.19±0.04 | 0.20±0.05 | 0.5480 | |
T2 max R (sec) | 0.51±0.06 | 0.54±0.052 | 0.0020* | |
T2 max L (sec) | 0.52±0.04 | 0.55±0.05 | 0.0001* | |
Butterfly diagram parameters | Walking line length L (mm) | 211.82±13.33 | 233.31±18.69 | 0.0001* |
Walking line length R (mm) | 209.16±15.45 | 232.15±17.79 | 0.0001* | |
Single support line L (mm) | 132.53±16.19 | 141.77±14.55 | 0.0001* | |
Single support line R (mm) | 133.02±13.41 | 141.73±14.78 | 0.0001* | |
Anteroposterior position (mm) | 6.25±6.48 | 6.00±3.77 | 0.1780 | |
Student’s t-test; BMI: Body mass index, GRF: Ground reaction force, R: right, L: left, SD: Standard deviation, *= p<0.05
No significant relationship was detected between the volunteers’ walking parameters and Q angle values (p>0.05) ().
Table 3. Correlation of Q angle and gait analysis data
Gait analysis parameters | Female (n=106) mean ± SD | Male (n=105) mean ± SD | ||||||||
|---|---|---|---|---|---|---|---|---|---|---|
Q supine R (°) | Q supine L (°) | Q standing R (°) | Q standing L (°) | Q supine R (°) | Q supine L (°) | Q standingR (°) | Q standing L (°) | |||
Foot rotation (°) | L | r | -0.042 | -0.099 | -0.084 | -0.105 | -0.087 | -0.140 | -0.088 | -0.094 |
p | 0.667 | 0.313 | 0.393 | 0.283 | 0.377 | 0.153 | 0.374 | 0.341 | ||
R | r | 0.049 | 0.082 | 0.104 | 0.134 | -0.008 | 0.005 | 0.068 | 0.051 | |
p | 0.617 | 0.403 | 0.289 | 0.169 | 0.937 | 0.960 | 0.491 | 0.604 | ||
Step width (cm) | r | 0.014 | -0.002 | -0.021 | -0.027 | -0.080 | -0.088 | -0.006 | 0.011 | |
p | 0.889 | 0.984 | 0.829 | 0.785 | 0.418 | 0.370 | 0.955 | 0.910 | ||
Step length (cm) | L | r | 0.113 | 0.043 | 0.078 | 0.073 | 0.043 | -0.024 | -0.036 | -0.067 |
p | 0.250 | 0.661 | 0.428 | 0.455 | 0.661 | 0.808 | 0.719 | 0.498 | ||
R | r | 0.131 | 0.074 | 0.086 | 0.093 | 0.036 | -0.011 | -0.005 | -0.055 | |
p | 0.181 | 0.450 | 0.381 | 0.342 | 0.712 | 0.909 | 0.963 | 0.578 | ||
Double step length (cm) | r | 0.121 | 0.058 | 0.083 | 0.083 | 0.054 | 0.004 | -0.009 | -0.041 | |
p | 0.215 | 0.558 | 0.397 | 0.399 | 0.588 | 0.970 | 0.930 | 0.681 | ||
Step time (sec) | L | r | -0.071 | -0.056 | -0.061 | -0.062 | 0.009 | 0.035 | 0.026 | 0.103 |
p | 0.467 | 0.570 | 0.532 | 0.526 | 0.928 | 0.719 | 0.792 | 0.298 | ||
R | r | -0.033 | -0.089 | -0.126 | -0.123 | 0.092 | 0.084 | 0.051 | 0.102 | |
p | 0.736 | 0.364 | 0.198 | 0.210 | 0.350 | 0.392 | 0.608 | 0.301 | ||
Double step time (sec) | r | -0.049 | -0.024 | -0.048 | -0.051 | 0.067 | 0.077 | 0.055 | 0.100 | |
p | 0.620 | 0.805 | 0.524 | 0.605 | 0.498 | 0.434 | 0.578 | 0.308 | ||
Stance phase (%) | L | r | 0.104 | 0.086 | 0.157 | 0.130 | -0.055 | -0.047 | -0.033 | -0.014 |
p | 0.288 | 0.382 | 0.109 | 0.182 | 0.579 | 0.636 | 0.741 | 0.887 | ||
R | r | -0.047 | 0.011 | -0.032 | -0.007 | 0.006 | 0.015 | 0.002 | 0.082 | |
p | 0.630 | 0.909 | 0.741 | 0.945 | 0.951 | 0.876 | 0.983 | 0.407 | ||
Loading (%) | L | r | -0.033 | -0.005 | 0.015 | 0.021 | 0.051 | 0.044 | 0.043 | 0.101 |
p | 0.735 | 0.962 | 0.877 | 0.835 | 0.607 | 0.659 | 0.664 | 0.307 | ||
R | r | 0.094 | 0.110 | 0.137 | 0.154 | -0.092 | -0.088 | -0.085 | -0.027 | |
p | 0.336 | 0.261 | 0.162 | 0.116 | 0.350 | 0.373 | 0.387 | 0.82 | ||
Single support (%) | L | r | 0.015 | -0.037 | -0.018 | -0.052 | -0.068 | -0.060 | -0.046 | -0.124 |
p | 0.877 | 0.703 | 0.852 | 0.596 | 0.492 | 0.544 | 0.643 | 0.207 | ||
R | r | -0.054 | -0.041 | -0.085 | -0.093 | 0.065 | 0.071 | 0.028 | 0.005 | |
p | 0.583 | 0.675 | 0.389 | 0.341 | 0.510 | 0.470 | 0.778 | 0.957 | ||
Before swing (%) | L | r | -0.104 | -0.086 | -0.157 | -0.130 | 0.055 | 0.047 | 0.033 | 0.014 |
p | 0.288 | 0.382 | 0.109 | 0.182 | 0.579 | 0.636 | 0.741 | 0.887 | ||
R | r | 0.043 | -0.017 | 0.025 | 0.001 | -0.007 | -0.014 | -0.004 | -0.080 | |
p | 0.662 | 0.866 | 0.799 | 0.994 | 0.947 | 0.889 | 0.964 | 0.415 | ||
Total double support (%) | r | 0.063 | 0.101 | 0.108 | 0.120 | -0.014 | -0.030 | -0.014 | 0.038 | |
p | 0.522 | 0.301 | 0.272 | 0.221 | 0.887 | 0.764 | 0.884 | 0.699 | ||
Cadence (steps/minute) | r | 0.046 | 0.026 | 0.048 | 0.056 | -0.075 | -0.088 | -0.054 | -0.102 | |
p | 0.639 | 0.792 | 0.624 | 0.566 | 0.447 | 0.374 | 0.582 | 0.300 | ||
Speed (km/h) | r | 0.089 | 0.008 | 0.066 | 0.050 | -0.059 | -0.057 | -0.089 | -0.129 | |
p | 0.365 | 0.938 | 0.502 | 0.614 | 0.551 | 0.565 | 0.368 | 0.190 | ||
Spearman Correlation, R: Right; L: Left, SD: Standard deviation, r: Spearman correlation coefficient; 0-0.24 weakly, 0.25-0.49 moderately, 0.50-0.74 well, 0.75-1.00 strongly correlated, Q: Quadriceps angle
No statistically significant relationship was found between the calculated Q angle mean values and ground reaction force (GRF) parameters in women (p>0.05). In men, there was a negative correlation between the mean Q angle values measured at both supine and standing positions on the left side and the F1 max of the right and the mean values of F1 max and F2 max of the left (p<0.05). It was observed that there was a negative correlation between the men’s mean Q angle value measured while standing on the right and the mean F1 max value of the left (p< 0.05) ().
Table 4. Correlation of the quadriceps angle and butterfly diagram data
GRF parameters | Female (n=106) mean ± SD | Male (n=105) mean ± SD | ||||||||
|---|---|---|---|---|---|---|---|---|---|---|
Q supine R (°) | Q supine L (°) | Q standing R (°) | Q standing L (°) | Q supine R (°) | Q supine L (°) | Q standing R (°) | Q standing L (°) | |||
F1 max (N) | R | r | 0.139 | 0.138 | 0.128 | 0.122 | -0.174 | -0.254 | -0.139 | -0.222 |
p | 0.155 | 0.159 | 0.190 | 0.212 | 0.076 | 0.009* | 0.159 | 0.023* | ||
L | r | 0.065 | 0.044 | 0.031 | 0.033 | -0.182 | -0.271 | -0.228 | -0.268 | |
p | 0.507 | 0.651 | 0.752 | 0.737 | 0.062 | 0.005* | 0.019 | 0.006* | ||
F2 max (N) | R | r | 0.127 | 0.121 | 0.111 | 0.127 | -0.061 | -0.157 | -0.62 | -0.136 |
p | 0.196 | 0.215 | 0.257 | 0.193 | 0.539 | 0.110 | 0.528 | 0.166 | ||
L | r | 0.027 | 0.017 | 0.003 | 0.034 | -0.106 | -0.212 | -0.145 | -0.211 | |
p | 0.785 | 0.862 | 0.979 | 0.733 | 0.280 | 0.030* | 0.141 | 0.031* | ||
T1 max (sn) | R | r | -0.057 | -0.032 | -0.054 | -0.063 | 0.030 | 0.057 | 0.018 | 0.052 |
p | 0.560 | 0.747 | 0.581 | 0.520 | 0.760 | 0.566 | 0.858 | 0.601 | ||
L | r | 0.001 | -0.024 | -0.036 | -0.050 | 0.031 | 0.035 | 0.045 | 0.092 | |
p | 0.991 | 0.809 | 0.714 | 0.612 | 0.752 | 0.719 | 0.649 | 0.352 | ||
T2 max (sn) | R | r | 0.045 | 0.056 | 0.067 | 0.038 | 0.065 | 0.074 | 0.039 | 0.087 |
p | 0.647 | 0.569 | 0.496 | 0.696 | 0.507 | 0.452 | 0.691 | 0.380 | ||
L | r | -0.021 | 0.015 | -0.002 | 0.011 | 0.151 | 0.152 | 0.150 | 0.180 | |
p | 0.834 | 0.878 | 0.986 | 0.913 | 0.124 | 0.121 | 0.127 | 0.066 | ||
Spearman correlation, GRF: Ground reaction force, R: Right, L: Left, SD: Standard deviation, r: Spearman correlation coefficient; 0-0.24 weakly, 0.25-0.49 moderately, 0.50-0.74 well, 0.75-1.00 strongly correlated, *= p<0.05
In women, a weak correlation was observed between the mean value of the Q angle on the right knee and the length of the walking line on the right side and the single support line on the left side (r=0-0.24, p<0.05). It was observed that there was a weak correlation between the mean Q angle value measured while standing on the left knee and the length of the left walking line, the length of the right walking line and the left support line (r=0-0.24, p<0.05). In men, the mean Q angle values measured in the supine position were weakly related to the anteroposterior position in both knees (r=0-0.24; p<0.05). The mean Q angle values obtained from standing measurements were found to be moderately correlated (r=0.25-0.49; p<0.05) ().
Table 5. Correlation of the quadriceps angle and butterfly diagram data
Butterfly diagram parameters | Female (n=106) mean ± SD | Male (n=105) mean ± SD | ||||||||
|---|---|---|---|---|---|---|---|---|---|---|
Q supine R (°) | Q supine L (°) | Q standing R (°) | Q standing L (°) | Q supine R (°) | Q supine L (°) | Q standing R (°) | Q standing L (°) | |||
Walking line length (mm) | L | r | 0.135 | 0.108 | 0.178 | 0.198 | -0.007 | -0.065 | -0.025 | -0.094 |
p | 0.166 | 0.268 | 0.068 | 0.041* | 0.945 | 0.512 | 0.801 | 0.339 | ||
R | r | 0.201 | 0.161 | 0.233 | 0.238 | 0.022 | -0.046 | 0.002 | -0.035 | |
p | 0.039* | 0.099 | 0.016* | 0.014* | 0.822 | 0.643 | 0.986 | 0.724 | ||
Single support line (mm) | L | r | 0.223 | 0.158 | 0.228 | 0.192 | -0.008 | -0.026 | 0.044 | -0.062 |
p | 0.022* | 0.106 | 0.019* | 0.048* | 0.933 | 0.796 | 0.659 | 0.531 | ||
R | r | 0.162 | 0.099 | 0.158 | 0.122 | 0.083 | 0.054 | 0.099 | 0.026 | |
p | 0.096 | 0.315 | 0.106 | 0.213 | 0.402 | 0.581 | 0.315 | 0.793 | ||
Anteroposterior position (mm) | r | 0.077 | 0.077 | 0.188 | 0.080 | 0.140 | 0.230 | 0.213 | 0.256 | |
p | 0.433 | 0.433 | 0.053 | 0.414 | 0.153 | 0.018* | 0.029* | 0.008* | ||
Spearman correlation, R: Right, L: Left, SD: Standard deviation, r: Spearman correlation coefficient; 0-0.24 weakly, 0.25-0.49 moderately, 0.50-0.74 well, 0.75-1.00 strongly correlated, *= p<0.05
DISCUSSION
All parts of the lower extremity take part in ensuring movement and maintaining balance by performing a series of functions together and sequentially during walking. The knee joint is affected biomechanically and kinematically by the placement and alignment of other locomotor system structures of the lower extremity, . The fact that the Q angle is higher than the normal value range stated in the literature is associated with the dysfunction of the extension mechanism of the quadriceps femoris muscle and the lateral malposition of the patella and constitutes the basis for patellofemoral pain. It has been suggested that the increased anteversion angle of the femur or the internal rotation of the tibia causes the Q angle to increase, and the internal rotation of the tibia may be compensated by the eversion of the subtalar joint. Individuals with a wider Q angle may have a wider angle of eversion at the level of the subtalar joint, which can lead to lateral displacement of the patella.
As a result of their measurements using the traditional method, Aglietti et al. found the average value of the Q angle to be 15° and suggested that values above 20° were outside the normal. Kernozek and Greer measured average Q angle as 16.63±6.07° while the subjects were standing in their preferred position, and 14.57±8.06° when the heels were 4 cm apart and the feet were abducted 7°. Stating that the Q angle is in the range of 8-17° according to literature data and that the angle is wider in women, Woodland and Francis also stated in their study that the Q angle measured in the standing position is 0.9-1.2° higher than in the supine position. They suggested that this situation might be related to the load carried while standing. Guerra et al. suggested that there was no significant difference between the Q angle measured at supine and standing positions, but that the Q angle narrowed significantly when the quadriceps femoris muscle contracted, and this was due to the external and upward displacement of the patella.
In the study by Horton and Hall, the average Q angle value was found to be 13.5±4.5°, and the average Q angle value of women was 4.6° higher than that of men. They stated that there was no relationship between hip width and femur length and Q angle, regardless of gender factor. However, no information was given about whether the quadriceps femoris muscle was contracted or not and the foot position during the measurement.
There are studies in the literature suggesting that women have wider Q angles, , , . However, Grelsamer et al. suggested that the Q angle varied depending on height, not gender, and that there was no difference between genders when the distance between the two SIAS for pelvic width was measured. In that study, Q angles were measured only on the right knee in the supine position, with the knees flexed at 10°, and no information was given about the clinical conditions of the subjects.
There are studies supporting that individuals who lead an active life have a narrower Q angle. It has been suggested that increased sports activity affects the contraction power of the quadriceps femoris muscle, causing the Q angle to narrow, .
In our study, although there was a significant difference between the heights of the volunteers according to gender and the average Q angle values of women were higher than men, there was no significant difference in the average Q angle values between genders. In this respect, the results of our study differ from literature indicating that the average Q angle values of women are significantly higher than men. This difference may be due to the difference in the Q angle measurement method. We think that examination of other anatomical and anthropometric measurements of the lower extremity, such as pelvic width and the distance between SIAS and tibial tuberosity, may contribute positively to the evaluation.
In our study, the average value of the Q angle increased between 0.32 and 0.48 when moving from the supine position to the standing position. In this respect, our findings are compatible with literature information stating that the Q angle is wider in the supine position. The fact that the increase in angle value was not as high as in Woodland and Francis study may be related to the importance given to foot position in our measurements. In addition, the sample group in that study was selected from students receiving regular physical education. The sports habits of the volunteers participating in our study were not questioned.
In a study examining the relationship between hindfoot movement and Q angle in the stance phase of walking, it was found that there was a weak relationship between statically and dynamically measured Q angle and hindfoot movement. It has been said that walking with larger Q angle values is not associated with a larger eversion angle or hindfoot movement in the stance phase.
In our study, it was observed that there was no significant relationship between Q angle measurements and gait analysis data in both genders. When GRF parameters and Q angle data are compared, the lack of a relationship between F1 max and F2 max values of women may be related to the fact that these values are significantly lower than those of men. T1 max and T2 max values were not found to be related to Q angle in either gender.
Study Limitations
According to the data we obtained, it was observed that the average values of the Q angle were compatible with the values obtained using a similar measurement method, but did not show a significant difference between genders, , , . While there is no significant relationship between Q angle and gait analysis parameters in healthy young individuals, it was observed that there was a weak or moderately significant relationship with some of the GRF parameters and butterfly diagram parameters. At this point, the fact that our sample group consisted of healthy young adults and the mean values of the Q angle were within the normal range emerged as a limiting factor in terms of the generalizability of the results to different age groups and clinical situations. Another factor that limits our study is the Q angle measurement method because the use of a manual goniometer may negatively affect the objectivity of the data.
CONCLUSION
This study aimed to fill an important gap in the literature by evaluating the effects of Q angle on walking mechanics. The lack of a significant relationship between Q angle and gait analysis parameters in the sample of healthy young individuals indicates that the effects of Q angle on the gait cycle may be limited. However, it is clear that gender differences, physical activity level and dynamic processes need to be examined in a larger sample and with more sensitive methods. The findings of this study provide a new perspective on the usability of the Q angle in early diagnosis and treatment planning and serve as an important reference for future research.
Footnotes
Ethics
Ethics Committee Approval: The Ethics Committee approved this cross-sectional study for Scientific Research of the Faculty of Medicine of Trakya University, in accordance with the Declaration of Helsinki (decision no: 04/03, date: 01.03.2017).
Informed Consent: Volunteers were informed and then, their consent was obtained.
Footnotes
Authorship Contributions
Concept: O.T., E.U., Design: A.Z.Y.K., O.T., E.U., Data Collection or Processing: A.Z.Y.K., Analysis or Interpretation: A.Z.Y.K., O.T., E.U., Literature Search: A.Z.Y.K., E.U., Writing: A.Z.Y.K., O.T., E.U.
Conflict of Interest: No conflict of interest was declared by the authors.
Financial Disclosure: The authors declared that this study received no financial support.
References
Schulthies SS, Francis RS, Fisher AG, Van de Graaff KM. Does the Q angle reflect the force on the patella in the frontal plane? Phys Ther. 1995;75:24-30.
Livingston LA. The quadriceps angle: a review of the literature. J Orthop Sports Phys Ther. 1998;28:105-9.
Kuru İ, Haberal B, Avcı Ç. Patellofemoral biyomekanik. TOTBİD Dergisi. 2012;11:274-80.
Brattstroem H. Shape of the intercondylar groove normally and in recurrent dislocation of patella. a clinical and X-ray-anatomical investigation. Acta Orthop Scand Suppl. 1964;68:1-148.
Hungerford DS, Barry M. Biomechanics of the patellofemoral joint. Clin Orthop Relat Res. 1979:9-15.
Wilson T, Kitsell F. Is the Q-angle an absolute or a variable measure? Measurement of the Q-angle over one minute in healthy subjects. Physiotherapy. 2022;88:296-302.
Horton MG, Hall TL. Quadriceps femoris muscle angle: normal values and relationships with gender and selected skeletal measures. Phys Ther. 1989;69:897-901.
Grelsamer RP, Dubey A, Weinstein CH. Men and women have similar Q angles: a clinical and trigonometric evaluation. J Bone Joint Surg Br. 2005;87:1498-501.
Flandry F, Hommel G. Normal anatomy and biomechanics of the knee. Sports Med Arthrosc Rev. 2011;19:82-92.
Yucel BD. Quadriceps femoris açısının normal değerleri ve ve bu değerleri etkileyen faktörler: bir ön çalışma. Spor Bilimleri Dergisi. 1995;6:28-37.
Guerra JP, Arnold MJ, Gajdosik RL. Q angle: effects of isometric quadriceps contraction and body position. J Orthop Sports Phys Ther. 1994;19:200-4.
Woodland LH, Francis RS. Parameters and comparisons of the quadriceps angle of college-aged men and women in the supine and standing positions. Am J Sports Med. 1992;20:208-11.
Olcay E, Cetinus E, Mert M, Kara A. Evaluation and comparison of quadriceps angle of young men and women in supine and standing positions. Acta Orthopaedica et Traumatologica Turcica. 2006;28:25-7.
Sendur OF, Gurer G, Yildirim T, Ozturk E, Aydeniz A. Relationship of Q angle and joint hypermobility and Q angle values in different positions. Clin Rheumatol. 2006;25:304-8.
Smith TO, Hunt NJ, Donell ST. The reliability and validity of the Q-angle: a systematic review. Knee Surg Sports Traumatol Arthrosc. 2008;16:1068-79.
Herrington L, Nester C. Q-angle undervalued? The relationship between Q-angle and medio-lateral position of the patella. Clin Biomech (Bristol). 2004;19:1070-3.
Tsujimoto K, Kurosaka M, Yoshiya S, Mizuno K. Radiographic and computed tomographic analysis of the position of the tibial tubercle in recurrent dislocation and subluxation of the patella. Am J Knee Surg. 2000;13:83-8.
Mizuno Y, Kumagai M, Mattessich SM, Elias JJ, Ramrattan N, Cosgarea AJ, et al. Q-angle influences tibiofemoral and patellofemoral kinematics. J Orthop Res. 2001;19:834-40.
Powers CM. The influence of altered lower-extremity kinematics on patellofemoral joint dysfunction: a theoretical perspective. J Orthop Sports Phys Ther. 2003;33:639-46.
Özaras N, Yalçın S, Yavuzer G, Gök H: Yürüme analizi (1st ed). Avrupa Kitapçılık, 2001.
Levine D, Richards J, Whittle MW. Whittle’s gait analysis e-book. 2012: Elsevier Health Sciences.
Karahan M, Özcan M, Cığalı BS. Balance evaluation and gait analysis after arthroscopic partial meniscectomy. Indian J Orthop. 2022;56:1199-1205.
Kernozek TW, Greer NL. Quadriceps angle and rearfoot motion: relationships in walking. Arch Phys Med Rehabil. 1993;74:407-10.
Özcan Ö. Clinical examination of patellofemoral joint. TOTBİD Dergisi. 2012;11:290-3.
Subotnick SI. Orthotic foot control and the overuse syndrome. Phys Sportsmed. 1975;3:75-9.
Aglietti P, Insall JN, Cerulli G. Patellar pain and incongruence I: measurements of incongruence. Clin Orthop Relat Res. 1983:217-24.
Eliöz M, Atan T, Saç A, Yamak B. The investigation of the relationship between some physical features with q angle in athletes and sedanteries. Journal of Sports and Performance Researches. 2015;6:58-65.
Bayraktar B, Yucesir I, Ozturk A, Cakmak AK, Taskara N, Kale A, et al. Change of quadriceps angle values with age and activity. Saudi Med J. 2004;25:756- 60.