
Abstract
Aim
Female genital cosmetic procedures (GCP) are becoming a trending topic as the demand for GCP and cosmetic usage has increased. This study aimed to assess women’s changes/intended changes in cosmetic use parameters and their attitudes toward GCP following/in the event of pregnancy or delivery.
Materials and Methods
This cross-sectional and questionnaire-based study included 98 pregnant women (PW), 82 non-PW (NPW) of reproductive age, and 96 puerperal women (PuW). Knowledge about GCP, willingness to have any GCP, and cosmetic use parameters were established, and the Female Genital Self-image scale (FGSIS) was applied.
Results
Women who wanted GCP had lower FGSIS scores (p=0.015). The proportion of women with a university or higher education level was significantly higher among women who considered having GCP in the NPW (76.5%, p=0.021) and PuW (42.5%, p=0.015) groups. More NPW stated they would change their criteria and information sources related to cosmetics in the event of pregnancy/delivery compared to other groups (p<0.001). A significant proportion of NPW thought to stop using blush, powder, and concealer in the case of pregnancy, and lipstick, mascara, makeup remover, and foundation in the case of pregnancy/delivery (p<0.05).
Conclusion
Healthcare professionals should be aware of and address the demand for GCP and cosmetic usage among women, including pregnant and PuW.
Keywords: Cosmetics, genital cosmetic, female genital self-image, pregnancy, puerperium
INTRODUCTION
Female genital cosmetic procedures (GCP) are defined as legal procedures performed to improve the appearance of the genital area in the absence of medical indications, such as labiaplasty, vaginoplasty, and hymenoplasty. An increasing number of women are pursuing surgical modification of the genitalia for cosmetic reasons. According to the Aesthetic Plastic Surgery National Databank statistics, vaginoplasty, labiaplasty, and clitoral hood reduction surgeries have increased by 374%, 36%, and 128%, respectively, from 2020 to 2021.
Cosmetics, including personal care products (PCP) or make-up products (MUP), that contain various chemical substances are widely used in daily life, . The association between cosmetic use and increased personal exposure to substances such as benzophenone, paraben, and phthalate has been shown in various studies, . In addition, individual exposure to some of these substances, especially phthalates and phenols, is reportedly related to adverse pregnancy outcomes, .
Pregnant women (PW) may experience skin changes that are not attractive, such as melasma, striae, or acne. Likewise, some problems in the genital region related to delivery methods may exist in the puerperium. General cosmetic use habits can change, and a need for modification of the genitalia may arise for cosmetic reasons. As such, women are vulnerable to the potential risks of chemicals in cosmetics.
Understanding women’s attitudes towards GCP and their demand for these procedures would contribute to the awareness and knowledge of healthcare professionals. This study aimed to assess the changes in cosmetics use parameters (the criteria of choice of cosmetic products, information sources considered while choosing cosmetics, regularly used cosmetic products), GCP knowledge, and the attitudes toward GCP following pregnancy/delivery, or intended changes in the event of pregnancy/delivery. Secondly, we assessed the relationship between the Female Genital Self-image scale (FGSIS) and attitudes toward GCP.
MATERIALS AND METHODS
Study Population
This cross-sectional questionnaire-based study was conducted between April 2023 and October 2023 in the obstetrics and gynecology (OB/GYN) outpatient clinic of our tertiary referral hospital.
The study population consisted of three groups: PW, non-pregnant women of reproductive age (NPW), and puerperal women (PuW). Women 18-45 years of age from the same geographical region who agreed to participate in the study and gave informed consent were included.
Group exclusion criteria were:
• Depression in pregnancy, ectopic or molar pregnancy, having a fetus with an intrauterine anomaly for PW;
• Giving birth ≥6 weeks ago, postpartum depression, having a baby with a congenital anomaly for PuW;
• History of previous pregnancies, current pregnancy, being in the puerperal or perimenopausal period for NPW.
The study was approved by the Non-Interventional and Clinical Research Ethics Committee of Tekirdağ Namık Kemal University (decision no: 2023.28.02.06, date: 28.02.2023) and was carried out following the principles of the 1975 Declaration of Helsinki as revised in 2000. All participants signed informed consent before participating in the study.
Data Collection
All participants were asked to complete a self-administered questionnaire comprising socio-demographic data (age, education status, socioeconomic status, residence, occupation) and obstetrical data (gestational week, delivery week, birth weight, previous pregnancy number, first maternal age, preterm birth, multiple pregnancies, delivery method, abortus) for PW and PuW groups.
The criteria for choice of cosmetics (ingredients, price, brand, odor, advice of doctors or friends, appearance, habit, user comments, net contents, package, satisfaction), information sources considered while choosing cosmetics (commercials, social media phenomena, dermatologists’ or friends’ advice, internet, estheticians, TV programs, user comments on blogs), purchasing frequency (once a month, quarterly, twice a year, once a year, other), choices of make-up ingredients (fat-free, alcohol-free, paraben-free, unpolished, non-comedogenic, natural), and regularly used cosmetic products were established by an OB/GYN resident directly asking each woman.
Use habits were established for 36 cosmetics: 14 MUP (blush, lipliner, lipstick, mascara, eye shadow, eyeliner, eye pencil, eyebrow shadow, powder, concealer, foundation, make-up remover, nail polish, and nail polish remover) and 22 PCP [eight for general care (sunscreen, moisturizing cream, soap, shower gel, body peeling, perfume, deodorant, and collagen pills), seven for face (daily face cream, face night cream, facial cleanser, anti-aging serum, facial mask, facial tonic, and facial peeling), four for the genital region (cleanser, care lotions, deodorant, and bleaching cream), and three for hair (shampoo, dye, and mask)]. The use of cosmetics was evaluated based on general and regular use, irrespective of the frequency.
The thought of sufficient knowledge about GCP [labiaplasty, vaginoplasty (tightening, rejuvenation)], perineoplasty, vulvar or perianal bleaching, laser, cesarean section (C/S) scar revision, hymenoplasty, clitoral hood reduction, G-spot amplification) and willingness to have any GCP were established by an OB/GYN resident directly asking.
The changes/intended changes in cosmetic use parameters and willingness to have GCP following pregnancy or delivery were assessed by asking the following question: “Since the beginning of pregnancy/delivery (or in the event of pregnancy/delivery), have you changed (or will you change) the use of the criteria/information sources related to GCP?” (Yes/No).
Finally, the FGSIS, a Likert-type four-point (1: Strongly disagree to 4: Strongly agree) self-reported questionnaire consisting of seven items, was applied. The total possible score ranged between 7 and 28, with a higher score indicating better genital self-image.
Statistical Analysis
The statistical power for our sample size was 0.872, with an effect size of 0.30 and an alpha-type error of 0.05, which were calculated with the help of the G*Power 3.1.9.4 program using the χ2 -test family.
The Shapiro-Wilk test was used to assess the normality of variables. According to the normality results, continuous variables were presented as medians [interquartile range (IQR)], the Mann-Whitney U test was used for comparisons between two groups, and the Kruskal-Wallis test was used for comparisons between the three groups (e.g., FGSIS). Categorical variables were reported as n (%). The Pearson χ² or Fisher’s exact test was used to compare categorical variables (e.g., socio-demographic data, attitudes towards GCP/cosmetics). Pairwise comparisons were performed using the post-hoc test with the Bonferroni adjustment if the result of the chi-square test was significant. A cross-over analysis using McNemar’s χ² test was performed to compare the proportions of criteria, information sources, cosmetic use (MUP or PCP), make-up ingredients, and GCP before and after pregnancy or before and after delivery.
SPSS v.25 (IBM Corp, Armonk, NY, US) software was used for statistical analysis, and a p-value<0.05 was considered statistically significant.
RESULTS
Socio-demographic and Obstetric Data
The socio-demographic and obstetric data of the participants are presented in . Median (IQR) gestational week for PW was 35 (33-37). Of PW, 6 (7.1%) were in the second trimester, and 79 (92.9%) were in the third trimester. Multiple pregnancies occurred in 8 (8.2%) of 98 PW.
Table 1. Socio-demographic and obstetric data of the participants (n=276)
Characteristics (n, %) | PW (n=98) | NPW (n=82) | PuW (n=96) | p |
|---|---|---|---|---|
Age (years) ≤20 21-25 26-30 31-35 >35 | - 11 (11.7%) 34 (36.2%) 21 (22.3%) 15 (16%) 13 (13.8%) | - 6 (7.3%) 27 (32.9%) 11 (13.4%) 17 (20.7%) 21 (25.6%) | - 15 (15.6%) 18 (18.8%) 25 (26%) 19 (19.8%) 19 (19.8%) | 0.052 |
Education Elementary school High school University and higher | - 29 (29.6%) 35 (35.7%) 34 (34.7%)a | - 17 (20.7%) 17 (20.7%) 48 (58.5%)b | - 38 (39.6%) 32 (33.3%) 26 (27.1%)a | <0.001* |
Marital status Married Other | - 94 (95.9%)c 4 (4.1%)f | - 53 (%64.6)d 29 (%35.4)g | - 83 (87.4%)e 12 (12.6%)h | <0.001** |
Employed Yes No | - 15 (15.3%)i 83 (84.7%)l | - 45 (54.9%)j 37 (45.1%)m | - 32 (33.3%)k 64 (66.7%)n | <0.001*** |
Socioeconomics Low income Middle income High income | - 32 (32.7%) 57 (58.2%) 9 (9.2%) | - 19 (23.2%) 52 (63.4%) 11 (13.4%) | - 42 (43.8%) 46 (47.9%) 8 (8.3%) | 0.064 |
Residence Urban Non-urban | - 90 (95.7%) 4 (4.3%) | - 77 (97.5%) 2 (2.5%) | - 86 (89.6%) 10 (10.4%) | 0.062 |
Previous pregnancy 0 1 ≥2 First maternal age (years) ≤20 21-25 26-30 31-35 > 35 Preterm birth Yes No Multiple pregnancy Yes No Delivery method Vaginal C/S Both Abortus Yes No | - 20 (26.3%) 32 (42.1%) 24 (31.6%) - 10 (30.3%) 9 (27.3%) 12 (36.4%) 1 (3%) 1 (3%) - 12 (21.8%) 43 (78.2%) - 2 (3.6%) 53 (96.4%) - 18 (35.3%) 32 (62.7%) 1 (2%) - 17 (30.9%) 38 (69.1%) | - | - 23 (30.3%) 26 (34.2%) 27 (35.5%) - 16 (40%) 13 (32.5%) 7 (17.5%) 4 (10%) 0 - 12 (22.6%) 41 (77.4%) - 3 (5.9%) 48 (94.1%) - 15 (29.4%) 34 (66.7%) 2 (3.9%) - 11 (20.8%) 42 (79.2%) | - 0.605 - - - 0.230 - - - - - 0.918 - - 0.670 - - 0.717 - - - 0.229 |
*: Pairwise comparisons; b (Z-score = 4.3, p < 0.001) was significantly different from a. **: Pairwise comparisons; the differences between c and d, d and e, f and g, and g and h were significant (Z-scores were 4.1 for c, -5.6 for d, -4.1 for f, and 5.6 for g. p < 0.001). ***: Pairwise comparisons; the differences between i and j, j and k, i and k, l and m, m and n,
and l and n were significant (Z-scores were -4.7 for i, 4.9 for j, 4.7 for l, and -4.9 for m. p < 0.001). PW: Pregnant women, NPW: Non-pregnant women of reproductive age, PuW: Puerperal women, yrs: years, C/S: Cesarean section, Z-score: Adjusted residual
Median (IQR) delivery week for PuW was 38 (37-39). Preterm birth occurred in 14 (22.6%) women. The median (IQR) birth weight was 3200g (2760-3500). Low birth weight was seen in 8 (14%) deliveries, and no babies had high birth weights. Delivery methods were vaginal in 22 (22.9%) and C/S in 74 (77.1%) PuW, and 4 (4.2%) of 96 had multiple pregnancies.
GCP and FGSIS Scores
The GCP and FGSIS scores of the study groups are presented in . There were no significant differences in considering GCP between the study groups, except for labiaplasty, of which the percentage was highest in the NPW group and lowest in the PW group (p=0.015) ().
Table 2. Knowledge and attitudes toward GCP and the FGSIS group scores
- | PW | NPW | PuW | p |
|---|---|---|---|---|
Sufficient GCP knowledge Yes No | - 27 (28.7%) 67 (71.3%) | - 26 (31.7%) 56 (68.3%) | - 27 (28.4%) 68 (71.6%) | 0.873 |
Interested in at least one GCP Yes No | - 29 (29.9%) 68 (70.1%) | - 34 (41.5%) 48 (58.5%) | - 40 (41.7%) 56 (58.3%) | 0.161 |
Among participants considering having GCP Elementary school High school University and higher | - 5 (17.2%) 11 (37.9%) 13 (44.8%)a | - 4 (11.8%) 4 (11.8%) 26 (76.5%)b | - 9 (22.5%) 17 (42.5%) 14 (35%)a | 0.008* |
Considering having labiaplasty Yes No | - 5 (5.2%)c 92 (94.8%)e | - 15 (18.3%)d 67 (81.7%)f | - 16 (16.7%)d 80 (83.3%)f | 0.015** |
FGSIS [median (IQR)] | 21 (19-25) | 23 (19-27) | 22 (19-27%) | 0.518 |
*: Pairwise comparisons; b (Z-score =3.9, p=0.004) was significantly different from a. **: Pairwise comparisons; the differences between c and d, and e and f were significant (Z-scores were -3.2 for c and 3.2 for e. p=0.006). PW: Pregnant women, NPW: Non-pregnant women of reproductive age, PuW: Puerperal women, GCP: Genital cosmetic procedures, FGSIS: Female Genital Self-image scale, IQR: Interquartile range, Z-score: Adjusted residual
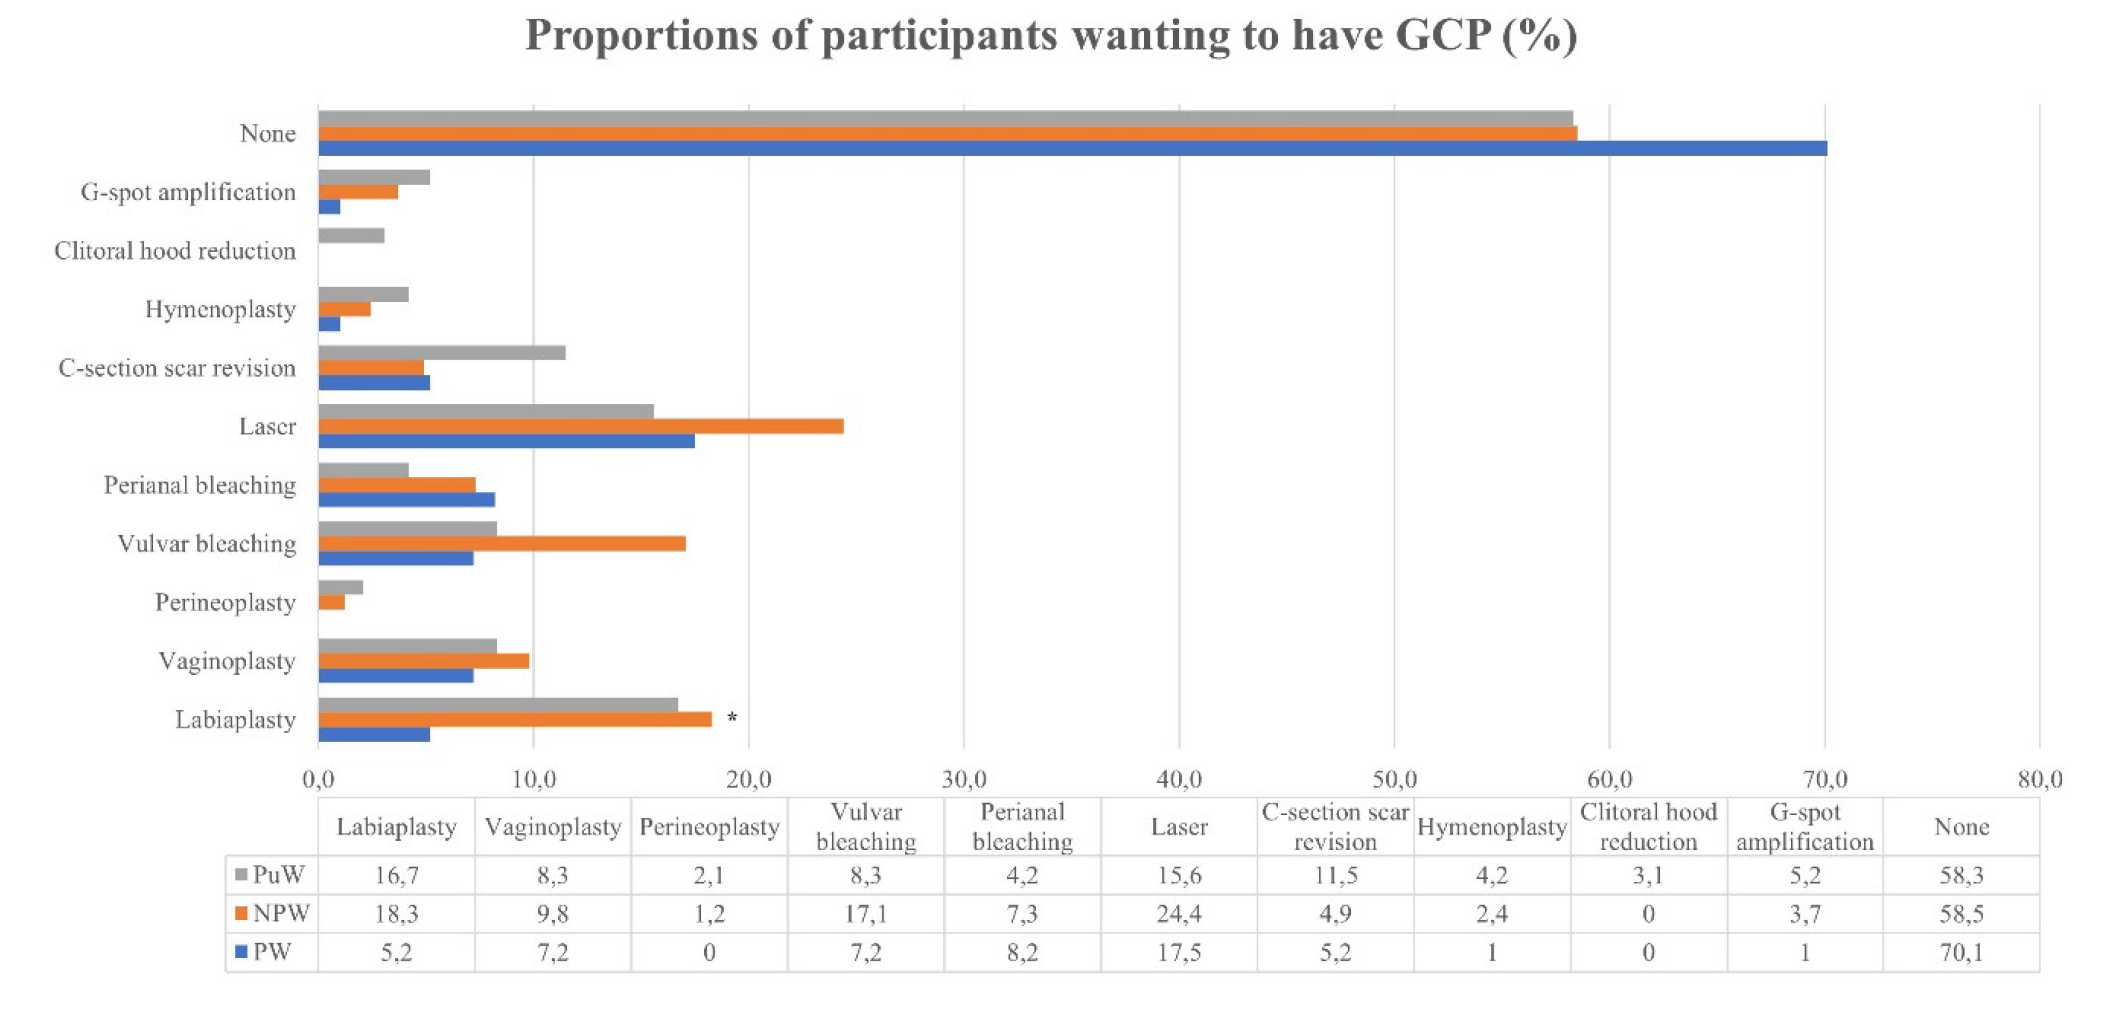
*: p=0.015. Pairwise comparisons: The proportion of PW was significantly different from the others. (Z-score: -3.2, p=0.006). GCP: Genital cosmetic procedures, PW: Pregnant women, NPW: Non-pregnant women of reproductive age, PuW: Puerperal women, Z-score: Adjusted residuals
FGSIS scores were significantly lower in the participants who would like to have at least one GCP (median, IQR=21, 18-25) compared to those who did not want any (median, IQR=23, 20-27) (p=0.015). There was no statistically significant relationship between considering having GCP and socio-demographic or obstetric features, except education level. In PW, NPW, and PuW groups, 44.8%, 76.5% (Z-score=3.9, p=0.004) and 35% of women, respectively, who thought about having GCP had a university or higher education level (p=0.008).
Changing Attitudes Concerning GCP
More NPW stated that their attitudes toward GCP would change in the event of pregnancy or childbirth compared to the other groups (p<0.001 and p<0.001, respectively) (). The attitudes of PW toward GCP were similar to those before pregnancy or in the event of delivery (p>0.05). Likewise, PuW had similar attitudes compared with pregnancy or before pregnancy (p>0.05).
Table 3. Changes in attitudes toward GCP
Changes/intended changes during/in the event of pregnancy | PW | NPW | PuW | p |
|---|---|---|---|---|
No | 70 (74.5%)a | 34 (41.5%)b | 60 (63.2%)a | <0.001* |
Yes | 8 (8.5%)c | 23 (28%)d | 5 (5.3%)c | |
Unknown | 16 (17%) | 25 (30.5%) | 30 (31.6%) | |
Changes/intended changes after/in the event of childbirth | PW | NPW | PuW | p |
No | 63 (67%)e | 34 (41.5%)f | 64 (68.1%)e | <0.001** |
Yes | 5 (5.3%)g | 19 (23.2%)h | 8 (8.5%)g | |
Unknown | 26 (27.7%) | 29 (35.4%) | 22 (23.4%) |
*: Pairwise comparisons; the differences between b and a, and d and c were significant (Z-scores were -4.2 for b and 4.7 for d. p<0.001). **: Pairwise comparisons; the differences between f and e, and h and g were significant (Z-score of f: -4, p=0.003; Z-score of h: 3.9, p=0.004). PW: Pregnant women, NPW: Non-pregnant women of reproductive age, PuW: puerperal women, Z-score: Adjusted residual
According to the cross-over analysis, most NPW who wanted a laser procedure stated that they would not have it during pregnancy (p=0.006). In addition, 10 and 16 women stated they would have C/S scar revision done in the event of pregnancy and childbirth, respectively (p=0.002) (). The attitudes toward the other GCP were similar to the intended attitudes in the event of pregnancy or childbirth (p>0.05).
Table 4. The cross-over analysis of changes in the attitudes toward GCP in the NPW group
GCP | Current attitudes | Intended attitudes in the event of pregnancy | p | |
|---|---|---|---|---|
Laser | No (n=42) | No (n=41) | Yes (n=1) | 0.006 |
Yes (n=15) | No (n=11) | Yes (n=4) | ||
C-section scar revision | No (n=56) | No (n=46) | Yes (n=10) | 0.002 |
Yes (n=1) | No (n=0) | Yes (n=1) | ||
GCP | Current attitudes | Intended attitudes in the event of labor | p | |
Laser | No (n=38) | No (n=35) | Yes (n=3) | 0.227 |
Yes (n=16) | No (n=8) | Yes (n=8) | ||
C-section scar revision | No (n=52) | No (n=36) | Yes (n=16) | <0.001 |
Yes (n= 2) | No (n=0) | Yes (n=2) | ||
GCP: Genital cosmetic procedures, NPW: Non-pregnant women of reproductive age
Cosmetic Product Use
The criteria for choice of cosmetics, information sources, and purchasing frequencies of cosmetics are summarized in . The criteria of choice of cosmetics changed in 34 (36.2%) PW and 14 (15.2%) PuW, compared to before pregnancy, and 49 (69.5%) NPW in the event of pregnancy (p<0.001). Additionally, the criteria of choice of cosmetics changed in 13 (14%) PuW after delivery, 16 (18.2%) PW, and 38 (46.3%) NPW in the event of delivery (p<0.001). The criteria of choice were ingredients and doctors’ advice for NPW in the case of pregnancy or delivery, and ingredients for PW in the event of delivery.
Table 5. Criteria for choice of cosmetics, information sources, and purchasing frequencies of cosmetics
Criteria | PW | NPW | PuW | p |
|---|---|---|---|---|
Ingredients | 54 (56.3%)a | 44 (53.7%)a | 31 (32.3%)b | 0.001* |
Price | 26 (27.1%) | 29 (35.4%) | 35 (36.5%) | 0.325 |
Brand | 43 (44.8%)c | 42 (51.2%)c | 18 (18.8%)d | < 0.001** |
Odor | 28 (29.2%) | 24 (29.3%) | 20 (20.8%) | 0.323 |
Doctors’ advice | 39 (40.6%) | 39 (47.6%) | 34 (35.4%) | 0.259 |
Appearance | 4 (4.2%) | 5 (6.1%) | 7 (7.3%) | 0.648 |
Friends’ advice | 9 (9.4%) | 19 (23.2%) | 21 (21.9%) | 0.026*** |
Habit | 16 (16.7%) | 20 (24.4%) | 13 (13.5%) | 0.158 |
User comments | 29 (30.2%) | 34 (41.5%) | 25 (26%) | 0.079 |
Net contents | 2 (2.1%) | 3 (3.7%) | 1 (1%) | 0.491 |
Package | 0 | 6 (7.3%) | 2 (2.1%) | 0.013*** |
Satisfaction | 47 (49%) | 50 (61%) | 39 (40.6%) | 0.025*** |
Other | 1 (1%) | 0 | 4 (4.2%) | 0.091 |
Information sources | PW | NPW | PuW | p |
Commercials | 10 (10.3%) | 16 (19.5%) | 16 (16.7%) | 0.209 |
Social media influencers | 12 (12.4%) | 16 (19.5%) | 11 (11.5%) | 0.251 |
Salesperson | 9 (9.3%) | 8 (9.8%) | 18 (18.8%) | 0.090 |
Dermatologists | 64 (66%)e | 60 (73.2%)e | 45 (46.9%)f | 0.001**** |
Internet | 11 (11.3%) | 15 (18.3%) | 12 (12.5%) | 0.364 |
Friends’ advice | 30 (30.9%) | 36 (43.9%) | 45 (46.9%) | 0.058 |
Estheticians | 19 (19.6%) | 18 (22%) | 20 (20.8%) | 0.927 |
TV programs | 0 | 4 (4.9%) | 7 (7.3%) | 0.032*** |
User comments on blogs | 26 (26.8%) | 27 (32.9%) | 17 (17.7%) | 0.063 |
Purchasing frequency | PW | NPW | PuW | p |
Once a month | 15 (16%) | 16 (19.8%) | 11 (12.5%) | 0.518 |
Quarterly | 15 (16%) | 22 (27.2%) | 17 (19.3%) | |
Twice a year | 20 (21.3%) | 17 (21%) | 20 (22.7%) | |
Once a year | 23 (24.5%) | 12 (14.8%) | 18 (20.5%) | |
Other | 21 (22.3%) | 14 (17.3%) | 22 (25%) |
*: Pairwise comparisons; b (Z-score: -3.6, p < 0.001) was significantly different from a. **: Pairwise comparisons: d (Z-score: -4.7, p<0.001) was significantly different from c.
***: Pairwise comparisons were insignificant according to post-hoc analysis with the Bonferroni adjustment. ****: Pairwise comparisons; f (Z-score: -3.6, p < 0.001) was significantly different from e. PW: pregnant women, NPW: Non-pregnant women of reproductive age, PuW: Puerperal women, Z-score: Adjusted residual
The information sources considered while choosing cosmetics changed in 13 (15.1%) PW and 6 (6.5%) PuW compared to before pregnancy and 25 (31.3%) NPW in the event of pregnancy (p<0.001). On the other hand, a change was reported by 4 (4.3%) PuW after delivery, 9 (10.2%) PW, and 24 (30%) NPW in the case of delivery (p<0.001). In the case of pregnancy or delivery, dermatologists’ advice was the leading information source for NPW. Similarly, dermatologists’ advice was the most frequent information source among PW in the event of delivery.
The proportions of participants using MUP regularly are presented in . In the PW group, six women stated that they gave up using foundation in pregnancy (p=0.031). Other changes in PW or PuW groups were not significant. The significant changes in the NPW group are presented in .
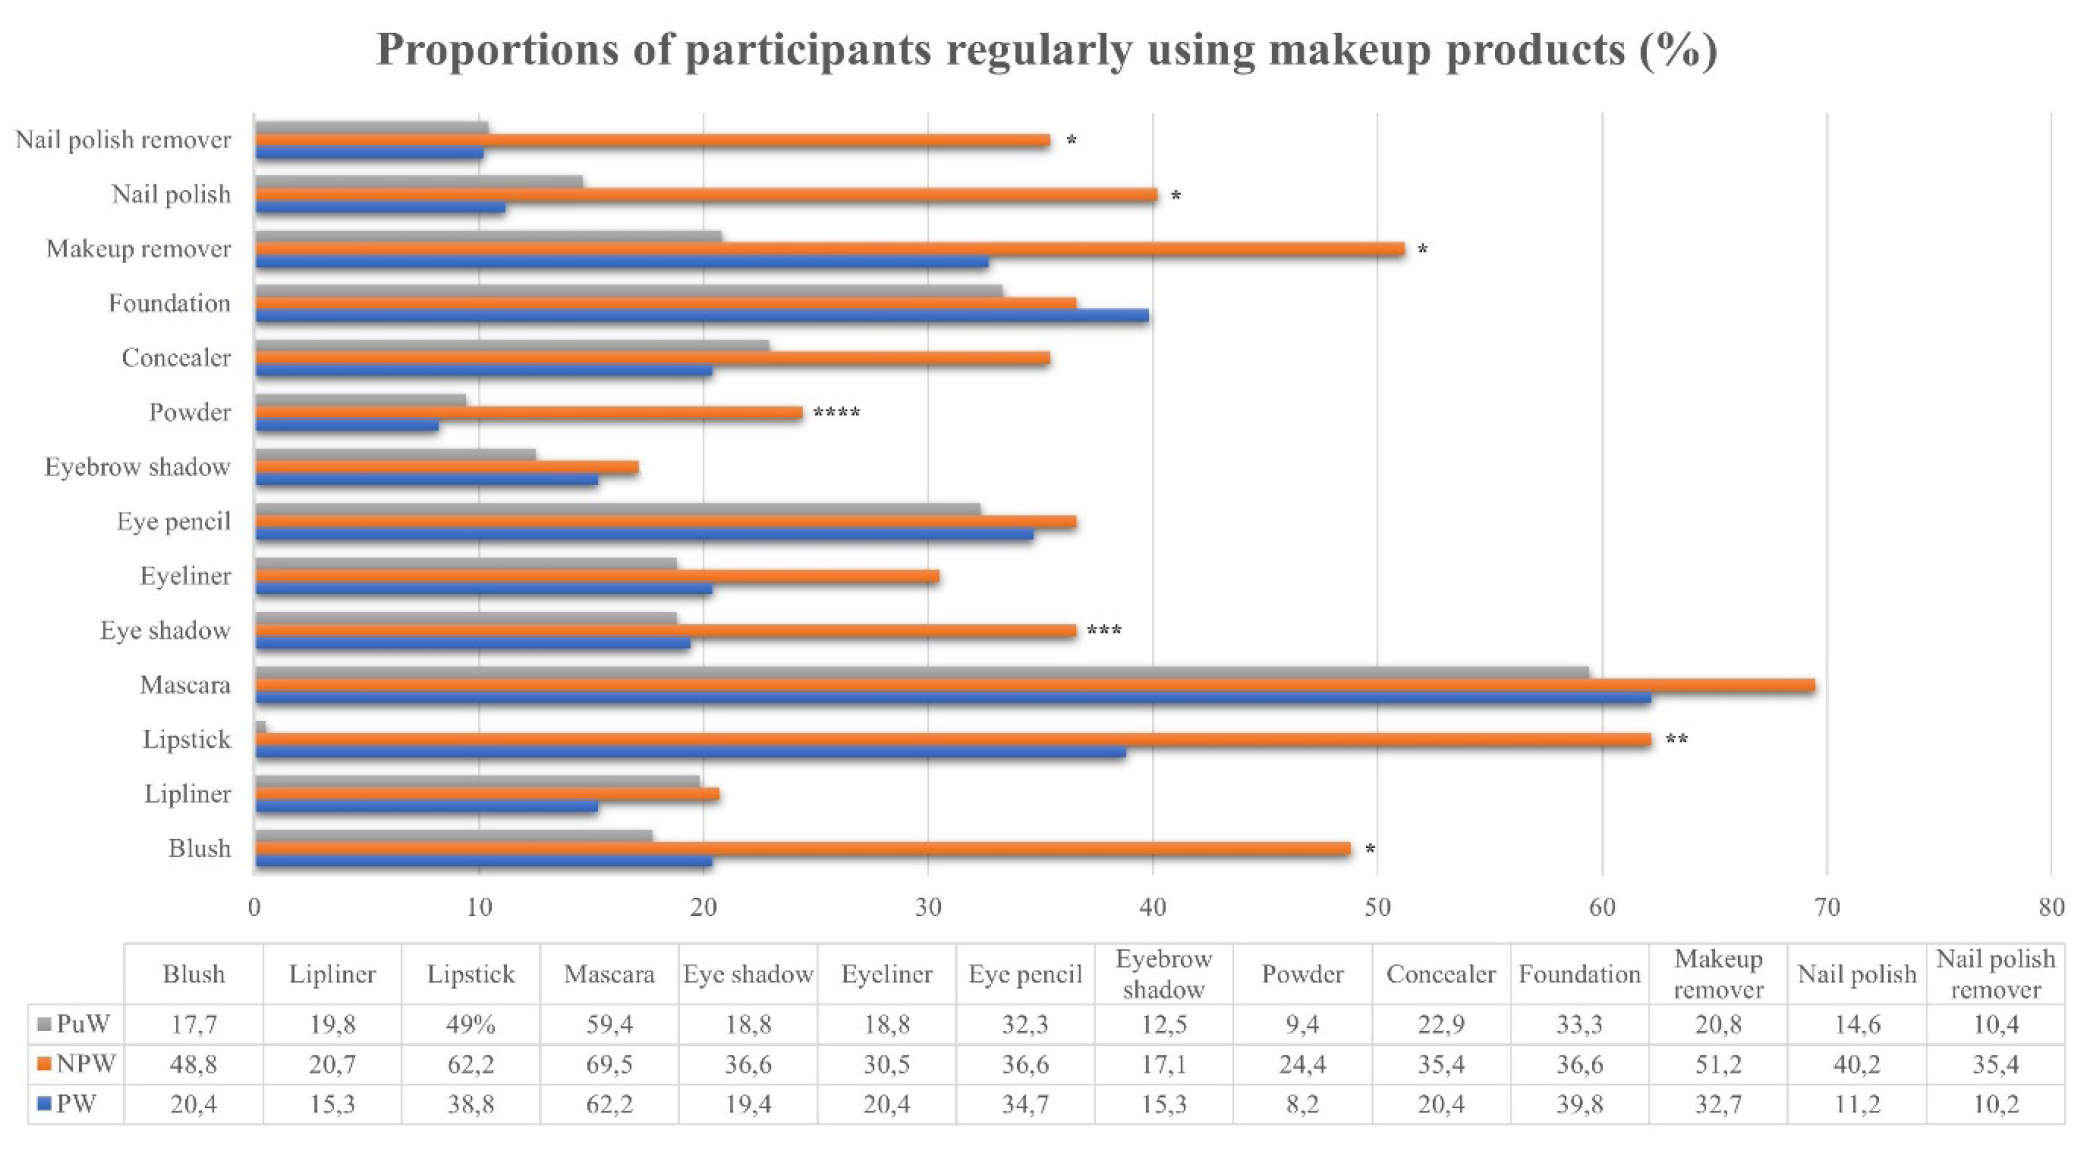
*: p<0.001. Post-hoc tests: Nail polish remover; Z-score of NPW: 5, p<0.001. Nail polish; Z-score of NPW: 5.1, p<0.001. Make-up remover; Z-score of NPW: 3.9, p<0.001. Blush; Z-score of NPW: 5, p < 0.001. **: p=0.007. Pairwise comparisons were insignificant according to post-hoc analysis with the Bonferroni adjustment. ***: p=0.008. Post-hoc tests: Eye shadow; Z-score of NPW: 3.1, p=0.0082. ****: p=0.002. Post-hoc tests: Powder; Z-score of NPW: 3.5, p<0.001. PW: pregnant women, NPW: Non-pregnant women of reproductive age, PuW: Puerperal women, Z-score: Adjusted residuals
Table 6. The cross-over analysis of changes in the use of MUP in the NPW group in the events of pregnancy or labor
Product | Current use | Intended use in the event of pregnancy | p | |
|---|---|---|---|---|
Blush | No (n=42) | No (n=42) | Yes (n=0) | 0.031 |
Yes (n=40) | No (n=6) | Yes (n=34) | ||
Lipstick | No (n=31) | No (n=31) | Yes (n=0) | 0.001 |
Yes (n=51) | No (n=11) | Yes (n=40) | ||
Mascara | No (n=25) | No (n=25) | Yes (n=0) | 0.008 |
Yes (n=57) | No (n=8) | Yes (n=49) | ||
Make-up cleaner | No (n=40) | No (n=40) | Yes (n=0) | 0.016 |
Yes (n=42) | No (n=7) | Yes (n=35) | ||
owder | No (n=62) | No (n=62) | Yes (n=0) | 0.031 |
Yes (n=20) | No (n=6) | Yes (n=14) | ||
Concealer | No (n=53) | No (n=53) | Yes (n=0) | 0.031 |
Yes (n=29) | No (n=6) | Yes (n=23) | ||
Foundation | No (n=52) | No (n=52) | Yes (n=0) | 0.016 |
Yes (n=30) | No (n=7) | Yes (n=23) | ||
Product | Current use | Intended use in the event of labor | p | |
Lipstick | No (n=31) | No (n=31) | Yes (n=0) | 0.004 |
Yes (n=51) | No (n=9) | Yes (n=42) | ||
Mascara | No (n=25) | No (n=25) | Yes (n=0) | 0.016 |
Yes (n=57) | No (n=7) | Yes (n=50) | ||
Make-up cleaner | No (n=40) | No (n=40) | Yes (n=0) | 0.008 |
Yes (n=42) | No (n=8) | Yes (n=34) | ||
Foundation | No (n=52) | No (n=52) | Yes (n=0) | 0.031 |
Yes (n=30) | No (n=6) | Yes (n=24) | ||
MUP: Makeup products. NPW: Non-pregnant women of reproductive age
The preferred make-up ingredients according to the study groups are summarized in . In the PW group, nine (10.2%) women stated a change in make-up ingredients compared to before pregnancy, whereas four (4.6%) noted an intended change in the event of delivery. In the NPW group, 16 (20.5%) and 12 (15.4%) women stated an intended change in the make-up ingredients in the event of pregnancy and delivery, respectively; however, these changes were not statistically significant (p>0.05).
Table 7. Makeup ingredient choices
Makeup ingredients | PW | NPW | PuW | p |
|---|---|---|---|---|
Fat-free | 17 (17.5%) | 21 (25.9%) | 14 (14.6%) | 0.144 |
Alcohol-free | 36 (37.1%) | 39 (48.1%) | 32 (33.3%) | 0.117 |
Paraben-free | 37 (38.1%) | 40 (49.4%)a | 24 (25%)b | 0.003* |
Unpolished | 23 (23.7%) | 34 (42%) | 25 (26%) | 0.018** |
Non-comedogenic | 35 (36.1%)c | 38 (46.9%)c | 19 (19.8%)d | 0.001*** |
Natural products | 62 (63.9%) | 41 (50.6%) | 55 (57.3%) | 0.201 |
*: Pairwise comparisons; b (Z-score: -3.1, p=0.0082) was significantly different from a. **: Pairwise comparisons were insignificant according to post-hoc analysis with the Bonferroni adjustment. ***: Pairwise comparisons, d (Z-score: -3.5, p < 0.001) was significantly different from c. PW: pregnant women, NPW: Non-pregnant women of reproductive age, PuW: Puerperal women, Z-score: Adjusted residual
The proportions of participants using PCP regularly are presented in . The use of face cream (p<0.001), shower gel (p=0.035), anti-aging serum (p=0.003), face night cream (p=0.002), face cleaner (p<0.001), face peeling (p=0.013), sunscreen (p=0.001), moisturizing cream (p=0.002), hair dye (p=0.001), and collagen pills (p=0.001) were significantly more frequent in the NPW group. All participants used more than one PCP. There were no significant changes in any group in the case of pregnancy or delivery in the use of PCP.
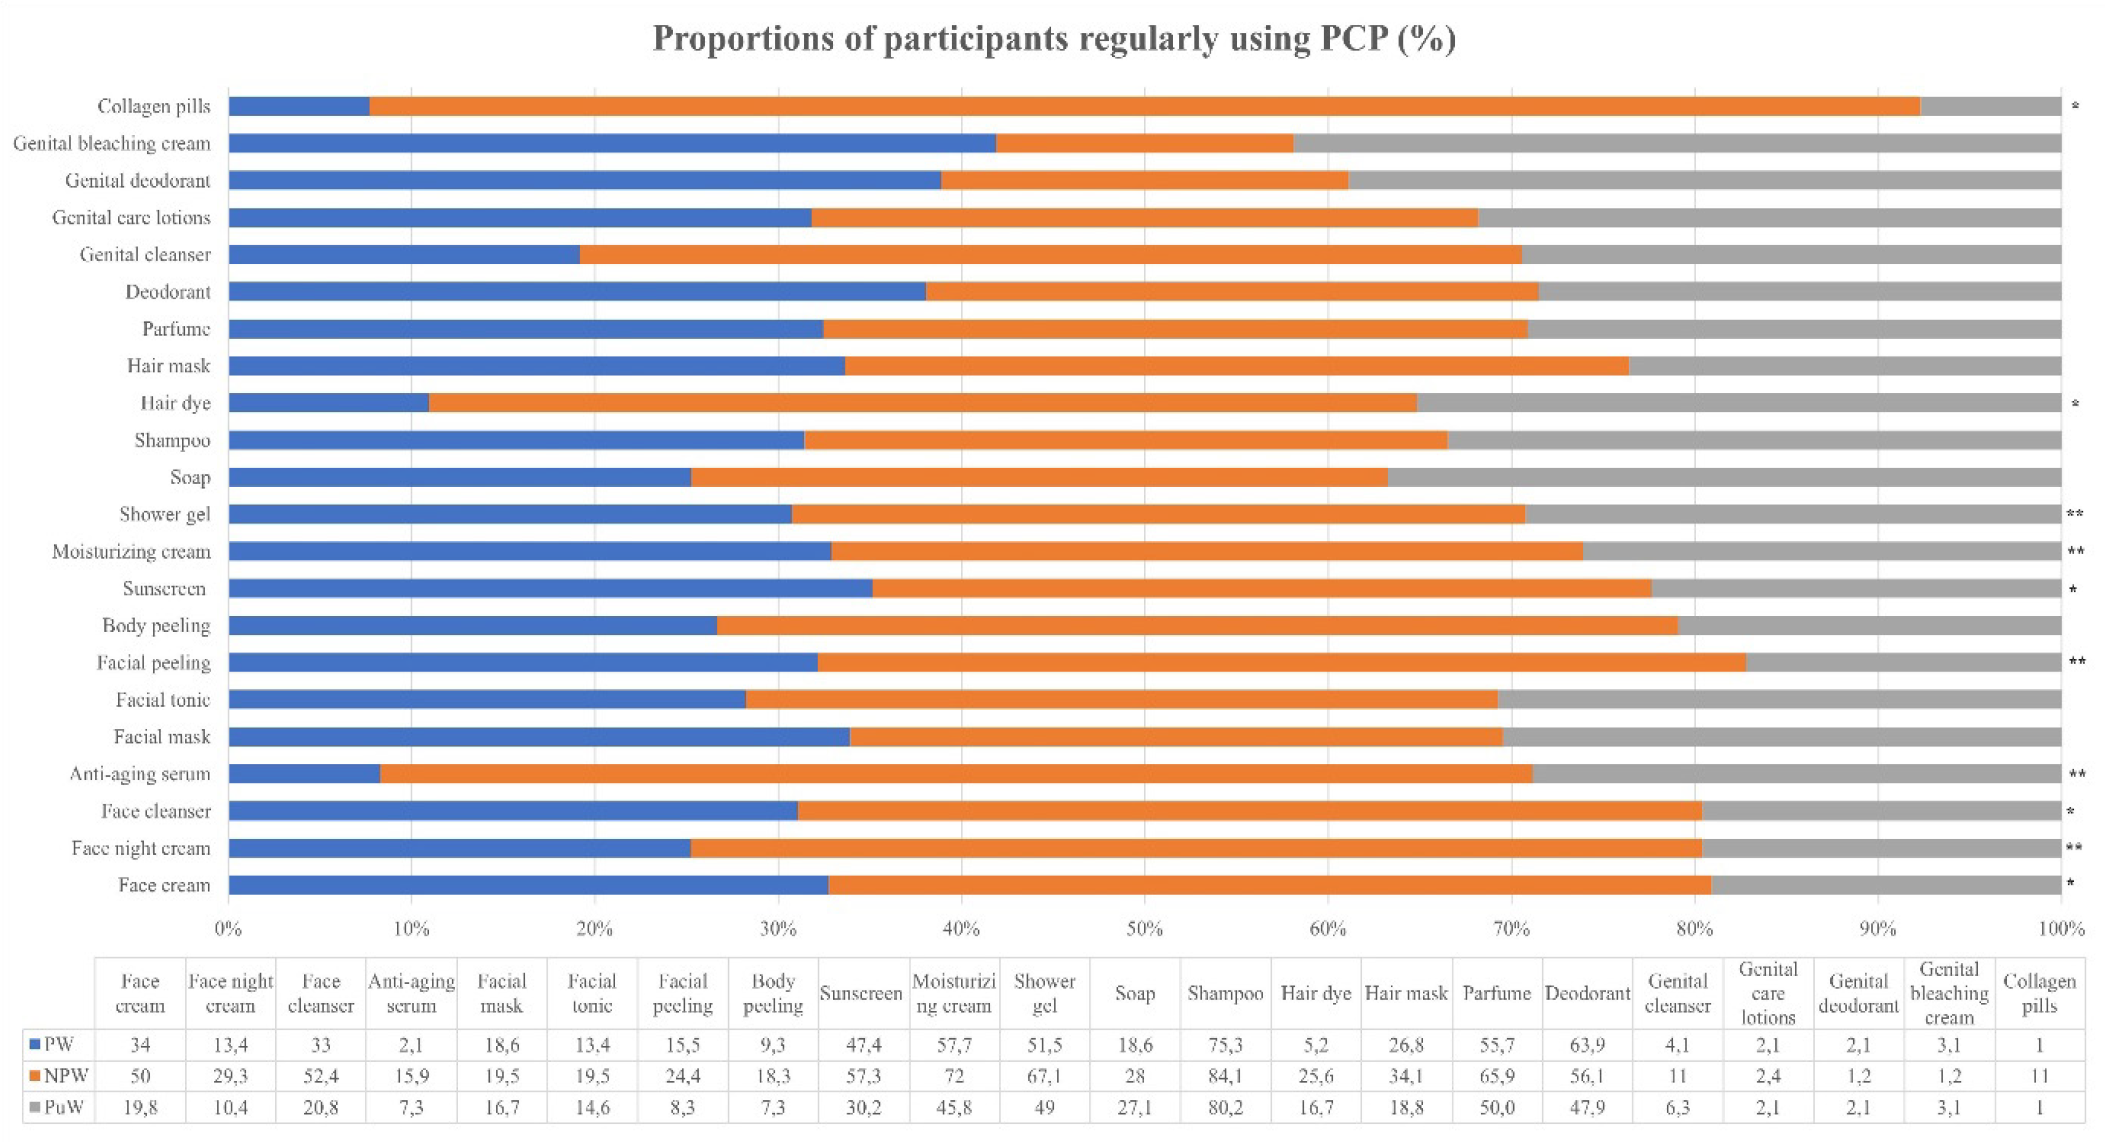
*: p≤0.001. Post-hoc tests: Collagen pills; Z-score of NPW: 3.8, p<0.001. Hair dye; Z-score of PW: -3.4, p<0.001. Sunscreen; Z-score of PuW: -3.5, p<0.001. Face cleanser; Z-score of NPW: 4.1, Z-score of PuW: -3.5, p<0.001). Face cream; Z-score of NPW: 3.7, Z-score of PuW: -3.6, p<0.001. **: p<0.05. Post-hoc tests: Moisturizing cream; Z-score of NPW: 3.1, p=0.0082. Anti-aging serum; Z-score of NPW: 3.1, p=0.0082. Face night cream; Z-score of NPW: 3.5, p<0.001. Pairwise comparisons of “shower gel” and “facial peeling” were insignificant according to post-hoc analysis with the Bonferroni adjustment. PCP: Personal care products, PW: Pregnant women, NPW: Non-pregnant women of reproductive age, PuW: Puerperal women, Z-score: Adjusted residuals
DISCUSSION
This study provides information on the attitudes toward GCP and the general use patterns for 36 widely used cosmetic products in PW, NPW, and PuW. More than half of the participants in all groups had negative attitudes toward GCP. Although FGSIS scores did not significantly differ between the groups, the scores were significantly lower among women who would like to have at least one GCP. In the event of pregnancy or delivery, the leading information source for cosmetics was dermatologists’ advice, and the criteria of choice were ingredients and doctors’ advice in the NPW group. Ingredients was the criterion of choice, and dermatologists’ advice was the leading information source for PW in the event of delivery.
Genital Cosmetic Procedures and FGSIS Scores
Many women experience undesirable changes in their genitalia, affecting sexual life, self-consciousness, and quality of life, whether due to childbirth, physical factors, or as a result of menopause. Nowadays, those unwanted changes can be improved with GCP.
Multiple factors play a role in the increasing demand for GCP among women, including information on social media, the Internet, and TV or the absence of accurate information about normal genital anatomy. In addition, women’s beauty perceptions may be changed by exposure to images of modified vulvas. Therefore, dissatisfaction with genital self-image may also be the reason for the increasing demand for GCP. On the other hand, cultural or religious reasons, such as the great importance of virginity, may cause women to seek GCP, like hymenoplasty. We do not know the exact statistics of GCP among the female population or how much information the women or healthcare professionals have about GCP in Türkiye. Thus, further studies are needed on this topic.
Most participants did not think they had sufficient knowledge about GCP. In addition, more than half of the women in all groups stated that they did not want GCP (). This attitude may be attributed to the paucity of knowledge about GCP or to the shyness and private approaches to genital problems in the study population. The other attributable reasons are financial resources to pay for such procedures and education level. Most participants were low/middle income in all groups. The proportion of women with an education level of university or higher was significantly higher among those who considered having GCP in the NPW and PuW groups. Therefore, we speculated that the lower the education level, the lower the knowledge or positive attitudes toward GCP.
The most desirable GCP were laser, perianal/vulvar bleaching, and vaginoplasty for PW, laser, labioplasty, vulvar bleaching, and vaginoplasty for NPW, and labioplasty, laser, C/S scar revision, vaginoplasty, and vulvar bleaching for PuW. For the NPW group, the proportion of women who thought to change their attitudes toward GCP in the event of pregnancy or delivery was significantly higher compared to the other groups. The pregnant and PuW had similar attitudes compared to before or after pregnancy or in the event of delivery. However, for NPW, only the attitudes toward laser and C/S scar revision significantly changed. The majority of women had negative attitudes toward laser in the event of pregnancy. C/S scar revision was the leading GCP that women would have in the case of pregnancy or delivery ().
Seeking GCP can be related to the negative effect of genital self-image on quality of life, dissatisfaction with genital appearance, or sexual performance, . Compatible with the literature, FGSIS scores were significantly lower in women who wanted GCP. However, participants were not evaluated regarding psychological background, such as depression, anxiety, or body dysmorphic disorder.
Cosmetic Product Use
Most PCP, especially genital hygiene and skincare products such as shampoo, shower gel, moisturizing cream, perfume, and deodorant, were widely used by all study groups as expected, compatible with the literature, . However, NPW generally used less PCP and MUP outside of pregnancy compared to the other studies-. Some PCP usages were significantly lower in PW and PuW compared to NPW, including face creams (day and night), facial cleansers, anti-aging sera, facial peeling, hair dyes, sunscreens, moisturizing creams, shower gels, and collagen pills. However, it was uncertain whether this trend was due to awareness of the potentially harmful effects of PCP or reduced self-care of women during those periods. Likewise, using some MUP, including blush, lipstick, eyeshadow, powder, make-up remover, nail polish, and nail polish remover, was significantly lower in PW and PuW. On the other hand, a significant proportion of NPW thought to stop using blush, powder, and concealer in the case of pregnancy, as well as lipstick, mascara, make-up remover, and foundation in the case of pregnancy or delivery. However, changes or intended changes were insignificant in the other groups, possibly related to the unequal educational levels between the study groups.
Most studies on the cosmetic use patterns in PW gathered data using 24 to 48-hour recall questionnaires for different PCP or MUP, , , . Marie et al. performed a questionnaire study about the routine use habits of cosmetics irrespective of usage frequency in pregnant and NPW. In that study, the products most commonly given up by PW were nail polish, nail polish remover, and hair dye. In addition, safe ingredients and odor were the new choice criteria among PW who changed their cosmetic use. In the event of pregnancy, NPW stated ingredients and professional advice as the criteria of choice. In the present study, a few PW indicated that they had given up using foundations (p=0.031). The other indicated changes were not significant. In the case of pregnancy or delivery, the ingredients and doctors’ advice were the criteria of choice.
Study Limitations
This study has some limitations, including a small sample size and potential information bias due to the cross-sectional and self-report questionnaire design. The possible confounders (education level, marital status, and employment status) that could influence the attitudes toward GCP and the prevalence of cosmetic use were not homogeneous between the study groups. Because 93.3% of PW were in the third trimester, there may be a potential recall bias about cosmetic use habits or attitudes toward GCP. This study could not assess the use habits according to the periods of pregnancy. Moreover, it did not analyze women’s perceptions of risk related to cosmetics. Although there was no significant relationship between the attitudes toward GCP and obstetric features, 77% of PuW gave birth by C/S, which could lead to an underestimation of the effects of vaginal birth on GCP demands. Lastly, the study could not evaluate women’s exact level of knowledge about GCP one by one.
CONCLUSION
This study compared the attitudes toward GCP and cosmetic use in PW, NPW, and PuW. The results of this study would help raise healthcare professionals’ awareness to inform women about GCP and cosmetics use during pregnancy or puerperium. Further studies with more substantial participant sizes representative of the general population are needed to verify and further this study’s findings.
Footnotes
Ethics
Ethics Committee Approval: The study was approved by the Non-Interventional and Clinical Research Ethics Committee of Tekirdağ Namık Kemal University (decision no: 2023.28.02.06, date: 28.02.2023) and was carried out following the principles of the 1975 Declaration of Helsinki as revised in 2000.
Informed Consent: All participants signed informed consent before participating in the study.
Acknowledgment
The authors declared that they did not receive financial support
Authorship Contributions
Concept: Ö.Z., İ.Ö.A., M.T.A., Design: Ö.Z., İ.Ö.A., M.T.A., Data Collection or Processing: İ.Ö.A., M.T.A., Analysis or Interpretation: Ö.Z., Literature Search: Ö.Z., İ.Ö.A., M.T.A., Writing: Ö.Z.
Conflict of Interest: No conflict of interest was declared by the authors.
Financial Disclosure: The authors declared that this study received no financial support.
References
Shaw D, Allen L, Chan C, Kives S, Popadiuk C, Robertson D, et al. Guideline No. 423: female genital cosmetic surgery and procedures. J Obstet Gynaecol Can. 2022;44:204-14.
Cosmetic Surgery National Data Bank Statistics. Aesthet Surg J. 2018;38(suppl_3):1-24.
Bocca B, Pino A, Alimonti A, Forte G. Toxic metals contained in cosmetics: a status report. Regul Toxicol Pharmacol. 2014;68:447-67.
Zota AR, Shamasunder B. The environmental injustice of beauty: framing chemical exposures from beauty products as a health disparities concern. Am J Obstet Gynecol. 2017;217:418.e1-e6.
Larsson K, Ljung Björklund K, Palm B, Wennberg M, Kaj L, Lindh CH, et al. Exposure determinants of phthalates, parabens, bisphenol a and triclosan in Swedish mothers and their children. Environ Int. 2014;73:323-33.
Ko A, Kang HS, Park JH, Kwon JE, Moon GI, Hwang MS, et al. The association between urinary benzophenone concentrations and personal care product use in Korean adults. Arch Environ Contam Toxicol. 2016;70:640-6.
Philippat C, Mortamais M, Chevrier C, Petit C, Calafat AM, Ye X, et al. Exposure to phthalates and phenols during pregnancy and offspring size at birth. Environ Health Perspect. 2012;120:464-70.
Li H, Zheng J, Wang H, Huang G, Huang Q, Feng N, et al. Maternal cosmetics use during pregnancy and risks of adverse outcomes: a prospective cohort study. Sci Rep. 2019;9:8030.
Ellibes Kaya A, Yassa M, Dogan O, Basbug A, Pulatoglu C, Caliskan E. The female genital self-image scale (FGSIS): cross-cultural adaptation and validation of psychometric properties within a Turkish population. Int Urogynecol J. 2019;30:89-99.
Veale D, Eshkevari E, Ellison N, Costa A, Robinson D, Kavouni A, et al. Psychological characteristics and motivation of women seeking labiaplasty. Psychol Med. 2014;44:555-66.
Lang C, Fisher M, Neisa A, MacKinnon L, Kuchta S, MacPherson S, et al. Personal care product use in pregnancy and the postpartum period: implications for exposure assessment. Int J Environ Res Public Health. 2016;13:105.
Meeker JD, Cantonwine DE, Rivera-González LO, Ferguson KK, Mukherjee B, Calafat AM, et al. Distribution, variability, and predictors of urinary concentrations of phenols and parabens among pregnant women in Puerto Rico. Environ Sci Technol. 2013;47:3439-47.
Wu XM, Bennett DH, Ritz B, Cassady DL, Lee K, Hertz-Picciotto I. Usage pattern of personal care products in California households. Food Chem Toxicol. 2010;48:3109-19.
Shaaban H, Alhajri W. Usage patterns of cosmetic and personal care products among female population in Saudi Arabia: important factors for exposure and risk assessment. J Environ Public Health. 2020;2020:8434508.
Manová E, von Goetz N, Keller C, Siegrist M, Hungerbühler K. Use patterns of leave-on personal care products among Swiss-German children, adolescents, and adults. Int J Environ Res Public Health. 2013;10:2778-98.
Marie C, Cabut S, Vendittelli F, Sauvant-Rochat MP. Changes in cosmetics use during pregnancy and risk perception by women. Int J Environ Res Public Health. 2016;13:383.
Just AC, Adibi JJ, Rundle AG, Calafat AM, Camann DE, Hauser R, et al. Urinary and air phthalate concentrations and self-reported use of personal care products among minority pregnant women in New York city. J Expo Sci Environ Epidemiol. 2010;20:625-33.
Buckley JP, Palmieri RT, Matuszewski JM, Herring AH, Baird DD, Hartmann KE, et al. Consumer product exposures associated with urinary phthalate levels in pregnant women. J Expo Sci Environ Epidemiol. 2012;22:468-75.