
Abstract
Aim
This study aims to develop an Urban health index (UHI) for Türkiye, grounded in the “capability to be healthy” framework.
Materials and Methods
Twenty-five routinely collected, publicly available provincial-level indicators were analyzed and categorized into four domains: economic, environmental conditions and services, and socio-cultural indicators. Using Microsoft Excel, the final UHI was calculated as a weighted average of 11 selected capability indicators. The under-five mortality rate (U5MR) was used as a proxy for population health. Geometric means, Spearman correlations, and Cronbach’s alpha were calculated in SPSS version 31.0.
Results
The 11-indicator index demonstrated high internal consistency (Cronbach’s alpha= 0.895). Strong negative correlations were observed between U5MR and indicators such as literacy (r= -0.881), poverty (r= -0.860), household overcrowding (r= -0.764), gender norms (r= -0.742), and civic engagement (r= -0.671).
Conclusion
The proposed UHI provides a novel, context-specific tool for assessing the structural and social determinants of health across Türkiye’s provinces. It enables both cross-provincial comparisons and the monitoring of temporal changes in urban health, contributing to evidence-based urban policy and health equity efforts.
Keywords: Urban metrics, Urban health index, population health, capabilities approach, child mortality, ecological study
INTRODUCTION
Urbanization is one of the main trends affecting health. As the global population continues to urbanize, it is imperative to understand how divergent urban experiences shape health and well-being. Multiple aspects of urban living such as physical environment, social structures, and the access to health and social services, have profound implications for health. Given the varying pace of urbanization and differences in city size, density, and social composition, “the relative importance of characteristics of the urban environment that may affect health may vary substantially in different cities and different parts of the world.” Türkiye has also experienced rapid urbanization over the past sixty years. According to recent data, over 75% of the population lives in urban areas. This continued rural-to-urban migration has placed a significant strain on infrastructure and had major repercussions on public health.
In this article, we propose an Urban Health index (UHI) for Türkiye using routinely collected, publicly available data to comparatively examine and assess the health levels of all provinces in Türkiye. Using statistical data on health outcomes and health determinants, the proposed UHI seeks to identify and categorize numerous indicators related to provincial health outcomes and to analyze the extent to which determinants influence health in Türkiye.
UHIs are essential tools for understanding the impact of various factors on health in urban settings. In other words, these indexes provide baseline information on urban health allowing for the assessment of progress in health outcomes over time-. UHIs also enable inter-province comparisons and help identify associations between health determinants and impacts, , . Lastly, UHIs facilitate the identification of health inequalities and the development of evidence-based policy recommendations on urban health. Although UHIs are socially constructed, they are also “rational tools” for instigating policy change, balancing scientific robustness and political motivation.”
Although limited, several UHI indexes have been created for Türkiye. The UHI proposed in this article differs from other indicator sets because it adopts a “capability approach to being healthy” focusing on how social and physical conditions in provinces lead to positive or negative health outcomes rather than the individual choices. Thus, the focus is on the underlying determinants of health, defined as, “the factors and conditions which protect and promote the right to health beyond health services, goods and facilities.” The UHI outlined in this article is a tool for upholding the right to health in Türkiye. It accomplishes this by identifying areas for intervention to improve the conditions of health determinants. As the right to health is subject to “progressive realization,” setting indicators and benchmarks is crucial to ensuring the enjoyment of this right. In this article, we assess health from a capabilities perspective and propose a UHI to understand the extent to which the right to health is upheld in Türkiye.
Constructing an UHI from a Capability to Be Healthy Perspective
The capabilities perspective, originally developed by Amartya Sen and expanded by Nussbaum, focuses on the set of functions that a person possesses in order to achieve a meaningful and valuable life. This approach has also been applied to the concept of health.
In his book Health Justice, Sridhar Venkatapuram argues that “every human being’s moral entitlement to a capability to be healthy.” He defines this capability as the ability to achieve or exercise a cluster of basic functions at a level that reflects human dignity. Venkatapuram views health as a “meta-capability” necessary for achieving the 10 basic capabilities identified by Nussbaum. For Venkatapuram, this capability can be understood as “a human right to be healthy”, which should be a central in discussions on social and global justice.
Living a long and healthy life requires more than just medical care and services. Essential elements for a healthy life include emotional nurturing, adequate nutrition, shelter, access to information, and protection from physical, psychological, and sexual abuse. Defining health only as the prevention of disease and impairment, is an incomplete definition of health, as it represents only one aspect of health. Health outcomes and capability to be healthy are shaped by social force including political, economic, legal, cultural and religious systems operating at local, national, and global levels. In other words, health is significantly shaped by our physical and social environments, and by the broader determinants of these environments.”
This article proposes a provincial-level UHI for Türkiye, using the capabilities approach. The objectives are twofold, 1) to identify and categorize the urban indicators that are related to health in Türkiye at the level of provinces and, 2) to analyze the extent to which these indicators influence urban health in Türkiye using the most up-to-date publicly available data. We believe this index will not only allow for comparisons across cities but will also provide a baseline for evaluating the impact future policies. It supports a shift toward the progressive realization of the right to health.
Adopting a capability-based health perspective allows us to distinguish between health as a functioning and health as a capability. In our index, health as a functioning is representing by the outcome indicator, while health as a capability is assessed through social and physical determinants of health. The UHI examines the correlations between health outcomes and a set of capability (determinants of urban health) indicators.
It is important to note that the association between health outcomes and health capabilities may vary by context. For example, some associations that hold true in underdeveloped societies may not be true in developed societies. Patterns seen in low-income countries may not apply in high-income settings. Therefore, we selected indicators that reflect Türkiye’s unique characteristics, to ensure the index is contextually appropriate. The UHI aims to offer insight into “possible and justifiable interventions” to improve the social and environmental conditions of health.
Although our index emphasizes the functioning and the capability aspects of health, it does not address the role of individual agency, that is the personal choices people make that influence their health. Moreover, while access to healthcare services is a key component of the right to health, this article focuses instead on how the social and physical aspects of urban life affect health. For this reason, the analysis excludes data on access to healthcare services. Our perspective is that health outcomes are shaped by a range of social and environmental factors, and their interactions, outside of the healthcare system.
MATERIALS AND METHODS
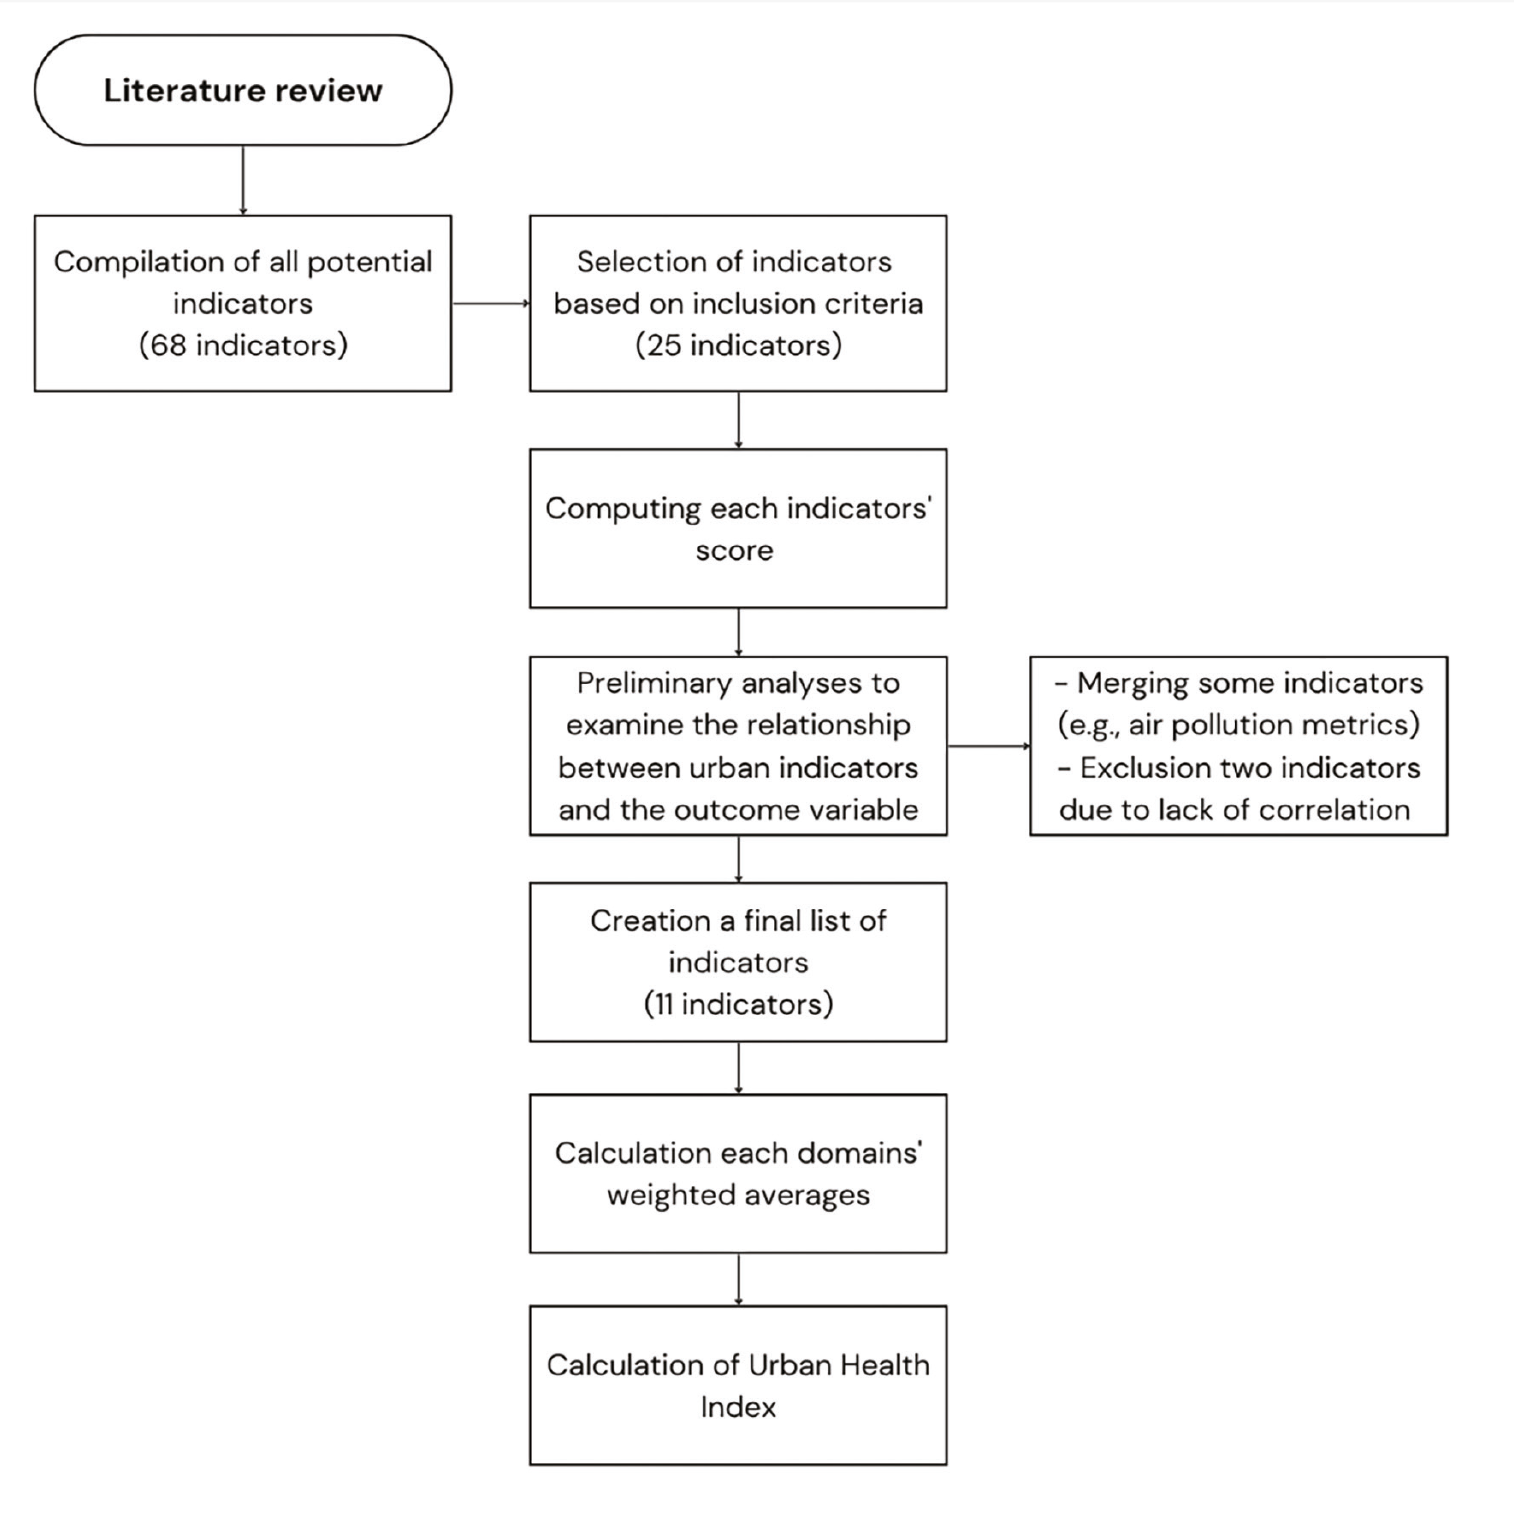
This study aimed to develop a feasible UHI for Türkiye using routinely collected, publicly available data in order to comparatively examine and assess the health outcome of all the provinces in Türkiye. This study is a retrospective study that used secondary data to construct an UHI. summarizes the steps taken in the study.
Literature Review
A literature review was conducted in two stages. First, a comprehensive search of international online databases (Pubmed, Web of Science, Google Scholar, and Scielo, and ScienceDirect) and was carried out for the following terms: “urban health and methodology”, “urban health indicators”, “UHI,” “healthy cities (or health city) and methodology”, “healthy cities (or health city) and indicators”, “healthy cities (or health city) and index.” Then, the authors searched and reviewed all the studies related to urban health indicators conducted in Türkiye. A keyword search for “urban health and Türkiye” and “healthy cities and Türkiye” was conducted for both international databases and national (Ulakbim and Dergipark) databases. Finally, a non-systematic search of reports and proceedings on urban health and UHIs in Türkiye was conducted.
There is a vast literature on urban health indicators. According to a systematic review published in 2018, there are 145 UHIs composed of 8006 indicators from 26 countries. Despite this vast literature, both the number and the quality of urban health indicator sets are limited in low and middle-income countries due to “a lack of quality data at the city level” and the limited capacities of some countries to analyze available data. This holds true for the case of Türkiye as well.
Most literature on indicators focus on the development and validation of UHIs. However, there is a lack of research on the utilization UHIs in urban planning policy-making, . Constructing an UHI specifically for Türkiye is an important task because it calls attention to the particular characteristics of Turkish provinces and increases the visibility and acceptability of the impact of these characteristics on health. Furthermore, given limited number of UHIs tailored specifically for Türkiye, and the fact that many of these are incomplete and/or outdated, it can be argued that “the process of indicator development (in the case of Türkiye) is at least as important as achieving change as the eventual use of indicators.” This initiative marks a pivotal first step towards instigating policy change in urban health in Türkiye.
As stated above, many urban indicator sets have been created over time. Given the variability in the impact factors on urban health in different cities, the health assessment tools should also be adapted accordingly, ranging from environmental factors to broader socio-economic and socio-cultural factors. The World Health Organization (WHO) attempted to develop a tool to measure for the cities participating in the Health Cities project in the early 1990s. The WHO Healthy Cities Network developed a set of 32 indicators for the purpose of “changing the ways in which individuals, communities, private and voluntary organizations, local governments think about, understand, and make decisions about health.” The healthy cities indicators have been adopted with some revisions, to the case of Türkiye by the Turkish Healthy Cities Association as well.
In addition to the healthy city indicators, the WHO developed the Urban Health Equity Assessment and Response Tool (Urban HEART) which focuses on urban health inequalities. In addition to the Urban HEART, the Euro-URHIS Project (European Urban Health indicators system) and the BRE Health Cities index are two international projects that created UHIs. These indexes focus on environmental indicators rather than health inequalities, . Although our UHI has been informed by all three indexes and entails the “lessons learned” from each of them, because our focus in this index has been to put forth a capability to be healthy perspective. For that reason, we had to create a novel index that included health as a functioning indicator combined with health as a capability indicator. This index incorporates both the social/cultural and the physical/environmental determinants of health.
In Türkiye, majority of research on UHIs has been conducted by municipalities rather than academic institutions. This research involves the creation of health profiles for cities and follow-up implementation projects. This led to a lack of comparative studies that could offer a holistic picture of urban health in Türkiye. Such studies are instrumental for developing actionable policy recommendations. The most comprehensive UHI project was undertaken by the Healthy Cities Movement Association in Türkiye (THCA).
In addition to the THCA healthy cities index, there are several studies have been conducted to develop composite index for measuring urban health in Türkiye. These studies focus on different aspects of urban health and its determinants. For instance, highlighting “the lack of a database for urban level (which) makes difficult to put forward the national relationship between urban and health”, Kara recommends to use 32 indicators under four categories. The fact that Kara’s index includes indicators of health behavior at the individual level such as levels of alcohol consumption, drug use, smoking, physical exercise, fruit and vegetable consumption, rather than those related to the physical and social characteristics of cities, prompted us to create a novel UHI that paid more attention to the latter. In another study that focuses on quality of life in urban areas in Türkiye, Sari and Kindap analyze the most repeated indicators in international indicator sets. The authors also refer to the lack of available data for measuring the quality of life in Turkish urban areas.
Selection Criteria of Indicators
A long list of all potential urban health indicators was created and were grouped following the domains borrowed from Pineo et al.: environment, social, health, and economy. We revised Pineo’s categories by splitting environment domain into two: environmental conditions and environmental health services. Whereas environmental conditions refer to the physical urban circumstances that are shaped by geographical location, previous urban planning etc., environmental health services refer to interventions that help ameliorate urban health.
Publicly available secondary data from Turkish Statistical Agency (TurkStat) and relevant Ministries (Ministry of Family, Labour and Social Services; Ministry of Forestry, Ministry of Health, Ministry of Justice, and Ministry of Education) were used as data sources to compose this index. In Türkiye, such data tend to be either available at the national, regional (NUTS I), subregion (NUTS II) or province-level (NUTS III).
We adopted the following criteria for selecting indicators: highly influenced by the built environment, demonstrates a link between the urban environment and health/well-being, globally relevant, and measurable by using public data. The inclusion criteria for the indicators were as follows:
- Representing either the health as a functioning (health outcomes) or health as a capability (determinants of health) in provinces
- Having causal connection with health
- Available for all 81 provinces
- Publicly accessible
- Accurate, reliable
In addition to these criteria, we also assessed the validity and the reliability of the data collected. Another significant factor that contributes to creating a suitable measurement method is accessibility of data; utilizing routinely collected sources is considered an advantage.
As outlined in , the third step, we included under-five mortality rate (U5MR) as a functioning indicator. This has been recommended by López Barreda et al. as a suitable health indicator that reflects the population’s achieved health status.
Finalizing the List of Indicators After Elimination
After searching for convenient indicators of urban health status, we considered the capability indicators that impact health as capability indicators under 4 separate yet interconnected domains: economy, environmental conditions and environmental services, and social. After exclusions, we analyze 25 capability indicators as seen which provides a list of the indicators utilized in the study.
Table 1. Indicator list, explanations and data sources
Domain/subcategories | Indicators of domains | Explanations | Data source and year |
|---|---|---|---|
Health | |||
Child mortality | Under-five mortality rate (U5MR) | U5MR is defined as the probability of dying a child before reaching the age of 5 years per thousand live births. It reflects the access of children and communities to basic health interventions such as vaccination, medical treatment of infectious disease and adequate nutrition in place of poor living conditions. | TurkStat, 2015-2019 |
Economy | |||
Income | Gross domestic product (GDP) per capita ($) | GDP is the standard measure of the value added created through the production of goods and services in the provinces. The main limitation is being an average for the province but not showing the distribution of it to the people equally. | TurkStat, 2019 |
Employment | % of active employee with social security | Proportion of actively employed population under social insurance system among older than 15 years old. It reflects to employment level. | Social Security Institution, 2019 |
Poverty | % of population under poverty line according to universal health insurance | It is rate of under poverty according to Turkish universal health system who has income less than one of third of minimal wage besides not having any property. Although it likely to underestimate all poor people, it is included because of allowing to make estimation based on province. | Social Security Institution, 2019 |
Social security coverage | % of covered by social security (active, passive, dependents and under poverty line) | Proportion of population covered by social insurance system due to active, passive, dependent, and under poverty line. It reflects to shield under social right provided by social security system. | Social Security Institution, 2019 |
Environmental conditions | |||
City density | Population density (per km2) | Population density per kilometer square. | TurkStat, 2019 |
Green spaces | m2 of forest per 10.000 people | The indicator on m2 per 10.000 people included to estimate green spaces, because the data on total green spaces in built environment including parks, recreation sites etc. is not available. | Ministry of Forestry, 2018 |
Air quality | Concentration of PM10 μg/m2 | It is included as an indicator because it is related to emissions of industrial pollution as well as other sources such as traffic, construction, etc. | Ministry of Environment and Urbanization, 2019 |
Air quality | Concentration of SO2 μg/m2 | It is a major air pollutant primarily released by the combustion of fossil fuels. | Ministry of Environment and Urbanization, 2019 |
Housing/crowded | Household size | It reflects the crowding of houses which is the average number of household members. Crowding is directly associated infectious diseases and mental health problems. | TurkStat, 2019 |
Crowded | The number of students per classroom | It represents public primary schools. Density of classrooms is related to transmission of communicable diseases among schoolchildren. | Ministry of Education, 2017-18 |
Environment health services | |||
Infrastructure | Expenses for waste management (TL) | Expenses for current + investment to waste management system (per capita, TL). It reflects sustainability of waste management system. It is calculated per capita. | TurkStat, 2016 |
Infrastructure | Expenses for wastewater management (TL) | Expenses for current + investment to wastewater management system (per capita, TL). It reflects sustainability of wastewater management system. It is calculated per capita. | TurkStat, 2016 TurkStat, 20162018, and 2020 |
Infrastructure | Expenses for water supply management (TL) | Expenses for current + investment to water supply system (per capita, TL). It reflects sustainability of water in the provinces. It is calculated per capita. | TurkStat, 2016 |
Wastewater treatment | Proportion of population served wastewater treatment plants (%) | Wastewater treatment involves the biological processing of wastewater and sewage before it is discharged into the environment. | TurkStat, 2016 TurkStat, 2018 TurkStat, 2020 |
Access to water | Proportion of population served by drinking water treatment plants (%) | Water treatment plants process surface water to make it safe for human consumption. | TurkStat, 2016 |
Waste management | Rate of population with solid waste collection (%) | It refers to the collection, transportation, processing, recycling, and disposal of waste materials in a way that minimizes their impact on human health and the environment. | TurkStat, 2016 |
Social-cultural indicators | |||
Population growth | Population growth rate between 2008 and 2018 | It is used to explore to not only childbirths but also immigration. Migration is a reality in recent years including unregistered migrants, as well. | TurkStat, 2010-2019 |
Education | Literacy among older than 15 years old | Literacy is related to development besides is a component of socioeconomic status. | TurkStat, 2020 |
Gender equality | % of self-employed women | It is calculated using no. of self-employed women by divided to total no. of women (15 yrs+). Rate of self-employed women which reflects opportunities of women and women’s entrepreneurship is an indicator for gender equality. | Social Security Institution, 2019 |
Women employment | % of women employees | This indicator represents the percentage of women employed under compulsory employer-based insurance. It reflects secure, formal employment, excluding flexible, part-time, or unpaid work arrangements such as family labor. | Social Security Institution, 2019 |
Conservativeness | Crude divorce rate (%) | Conservative social norms often discourage divorce and are closely associated with the continuation of marriages, even in cases of dissatisfaction. These patterns also reflect underlying gender dynamics. | TurkStat, 2019 |
Social recreation | No. of saloon for cinema and theatre per million population | It is calculated as total no. of cinema and theatre by divided to total population. It is related to social recreation opportunities. | TurkStat, 2019 |
Leisure/recreation | No. of sport club per 100.000 population | Although it is not reflecting whole population’s physical activity, it is an approximate to sport activity in the provinces. | TurkStat, 2019 |
Child protection | No. of 5-14 years children crime per thousand | It is assumed that child crime is a social issue instead of security issue. Passport violations are not included because of misleading high rates in provinces of frontier. | TurkStat, 2017 |
Social networks | No. of society per 100.000 population | This represents the social networks and is related to social capital and civic engagement capacity of the population. | TurkStat, 2019 |
TurkStat: Turkish Statistical Agency
U5MR was defined as the probability of dying a child before reaching the age of five years per thousand live births. It reflects the access of children and communities to basic health interventions such as vaccination, medical treatment of infectious disease and adequate nutrition in place of poor living conditions. The data of U5MR (per 1000 live births) were taken for analysis as the average of the past five years, 2015-2019. However, the urban indicators were used converting score as explained the following part.
Constructing Urban Health Index
We adopted the calculation method of the human development index recommended by most UHI studies. In brief, this method standardizes each indicator by using the following formula:
IS = [I -min* (I)] / [max (I) - min*(I)]
In the formula, I is the value of an indicator for a given unit (actual value), max (I) is the maximum value of I the indicator over all units, min* (I) is the minimum value of (I) over all units minus a small value or alternatively chosen.
The following indicators which negatively correlated with health outcomes were converted using formula 1 - IS (4): poverty, the levels of air pollutants (SO2 and PM10), household size, classroom crowded, population growth rate, and child crime.
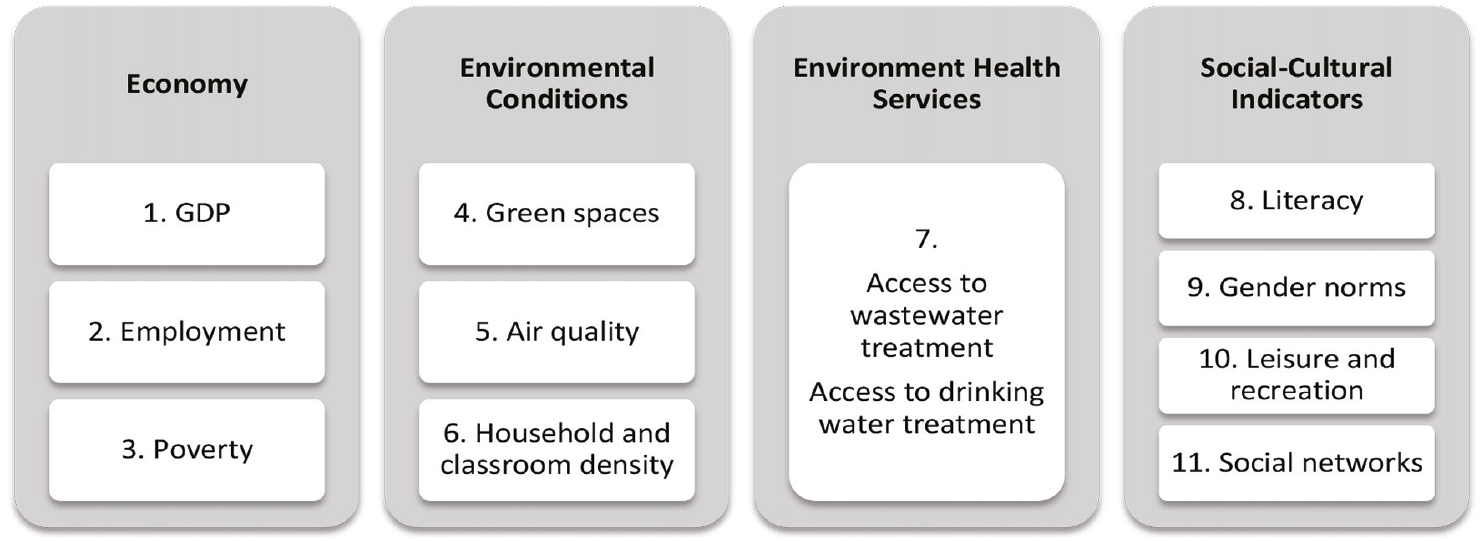
Standardization was carried out for indicators using data from all the 81 provinces in Türkiye. The similar indicators were aggregated using geometric averages for the weighed the domains. For this purpose, we aggregated the PM10 and SO4 as air pollution; household size and no. of students in classrooms as crowded in houses and schools; population served by drinking water treatment and wastewater treatment as environmental services; % of self-employed (entrepreneur) women, women employment in a secure job, and divorce rates as gender issues; and finally, no. of sport clubs and saloon for cinema and theatre as physical and social recreational opportunities. We excluded the social security coverage due to its low sensitivity to interprovincial differences and lack of correlation with U5MR. We also excluded the population density indicator was due to İstanbul’s skewed density and lack of correlation.
The total UHI was calculated by geometric mean of all indicators presented in .
GDP: Gross domestic product
Ethical Considerations
The data used in this study are anonymized, aggregate secondary data obtained from the Turkish Statistical Institute (TURKSTAT). Because the dataset is publicly accessible and contains no identifiable individual-level information, ethics committee approval was not required. Data collection and processing procedures at TURKSTAT comply fully with the European Statistics Code of Practice, ensuring statistical confidentiality, data protection, and scientific independence. All stages of the study were conducted in accordance with recognized standards of scientific integrity and publication ethics.
Statistical Analysis
After the data was prepared in Microsoft Excel® where each individual indicator was calculated and domain scores were constructed, the analyses were conducted using SPSS (IBM Statistical Package for Social Sciences), Version 31.0. In order to ensure internal consistency, Cronbach’s alpha values were calculated for all the indicators (0.895) which is viewed as an acceptable point to measure reliability. Then, Pearson’s correlation coefficient was applied to explore the associations between U5MR as a functioning and health as a capability. Normality assumption of correlation was met with the normality criteria.
RESULTS
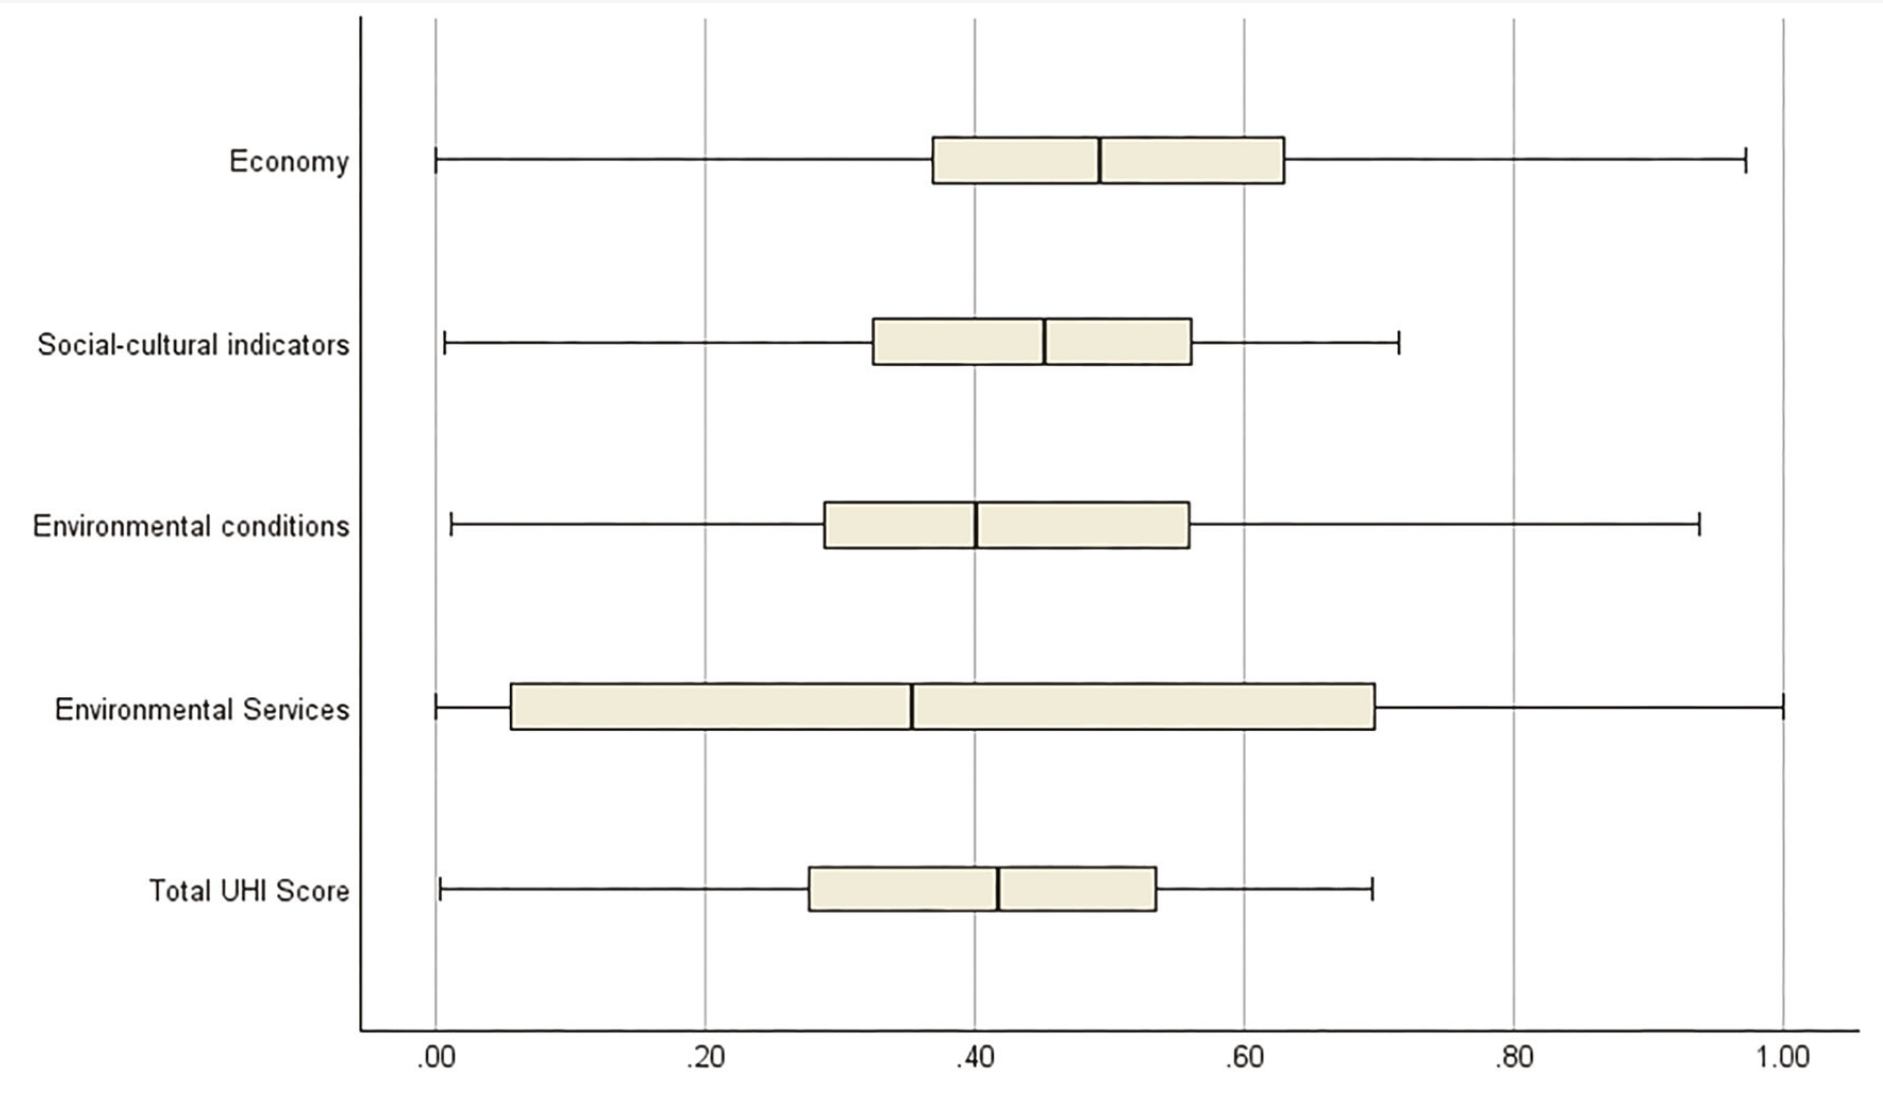
and provides separate scores for each of the four domains as well as the total UHI score for Türkiye. Provinces’ scores according to these four domains range broadly; the mean and median values indicate that distribution is not skewed except for the domain of environmental services which might stem from the variances in environmental services provided in provinces, especially with regards to investments.
Table 2. Descriptive statistics for indexes of urban health determinants by domain (no. provinces: 81)
- | Domains | Total UHI score | |||
|---|---|---|---|---|---|
- | Economy | Environmental conditions | Environmental health services | Social-cultural indicators | |
No. of provinces | 81 | 81 | 81 | 81 | 81 |
Median | 0.493 | 0.401 | 0.354 | 0.452 | 0.417 |
Mean | 0.491 | 0.422 | 0.406 | 0.427 | 0.400 |
Standard deviation | 0.210 | 0.194 | 0.326 | 0.175 | 0.169 |
Minimum | 0.000 | 0.012 | 0.000 | 0.006 | 0.004 |
Maximum | 0.972 | 0.938 | 1.000 | 0.714 | 0.694 |
UHI: Urban health index
UHI: Urban health index
According to our calculations, of the health as a functioning indicator, U5MR scores show significant correlations with UHIs of most domains ().
Table 3. Correlations between under-five mortality rate (per 1000 live birth) as functioning indicator of and the scores of capability domains
Domains | Related issues | Indicators | Correlation coefficient |
|---|---|---|---|
Economy | Income | Gross domestic product per capita ($) | -0.630** |
- | Employment | % of active worker with social security | -0.650** |
- | Poverty | % of population under poverty line (based on access to universal health) (converted) | -0.860** |
- | - | Economy domain | -0.752** |
Environmental conditions | Green spaces | Meter square of forest per 10.000 people | -0.332** |
- | Air quality | Concentration of PM10 and SO2 μg/m (converted) | -0.383* |
- | Housing/crowded | Household size and number of students per classroom (converted) | -0.764** |
- | - | Environmental conditions domain | -0.562** |
Environmental health services | Wastewater and drinking water treatment | Proportion of population served wastewater treatment plants and drinking water treatment plants | -0.372** |
- | - | Environmental health services domain | -0.372** |
Social-cultural indicators | Education | Literacy rate among older than 15 years old | -0.881** |
- | Gender norms | Proportion of self-employed women, women employees, and crude divorce rate | -0.742** |
- | Leisure and recreation | No. of sport club and cinema and theatre per population | -0.671** |
- | Social networks | No. of association per 100.000 population | -0.664** |
- | Total | Social facilities and opportunities | -0.871** |
Total UHI score | Weighted average of these indicators | -0.855** | |
*p<0.05, ** p<0.01, UHI: Urban health index
Among the domains, the scores of economy, environmental conditions, and social-cultural indicators show significantly moderate to strong correlations with U5MR, while the score of environmental services shows weak correlation to U5MR. As observed at , the distribution of environmental health services score is wide which means that distributed more equally compared to the other UHI domains.
In the economy domain, while gross domestic product, employment and poverty indicators show moderate to strong correlations with U5MR, respectively coefficients -0.630, -0.650, and -0.860 (). The indicator of social security coverage is not correlated (r= 0.031, data not shown), therefore, was not included to the overall UHI score, as mentioned in the method.
Under the environmental condition domain, we found that population density (r= -0.082, data not shown), levels of PM10 in ambient air (r= -0.163) were not correlated with U5MR. The scores of green spaces, SO2 as an air quality measure, and crowded in schools are observed moderate correlations while household size shows strong correlations with U5MR (r= -0.700). When we combine both air pollutants as one, air quality shows correlation with the child mortality (r= -0.383).
Under the environmental health services domain, we only used the wastewater treatment and drinking water treatment by excluding the other indicators which are the infrastructure expenses for waste management, wastewater management and water supply management, access to sewage and pipe system. The environmental health service score is weakly correlated with U5MR by the -0.372 correlation coefficient.
Lastly, our analysis shows that correlations between indicators in the social-cultral indicators domain and health as a functioning were generally robust. We found that literacy rate, gender norms, leisure and recreation indicators, number of societies per 100.000 are highly correlated with U5MR (ranging between 0.664 and 0.881).
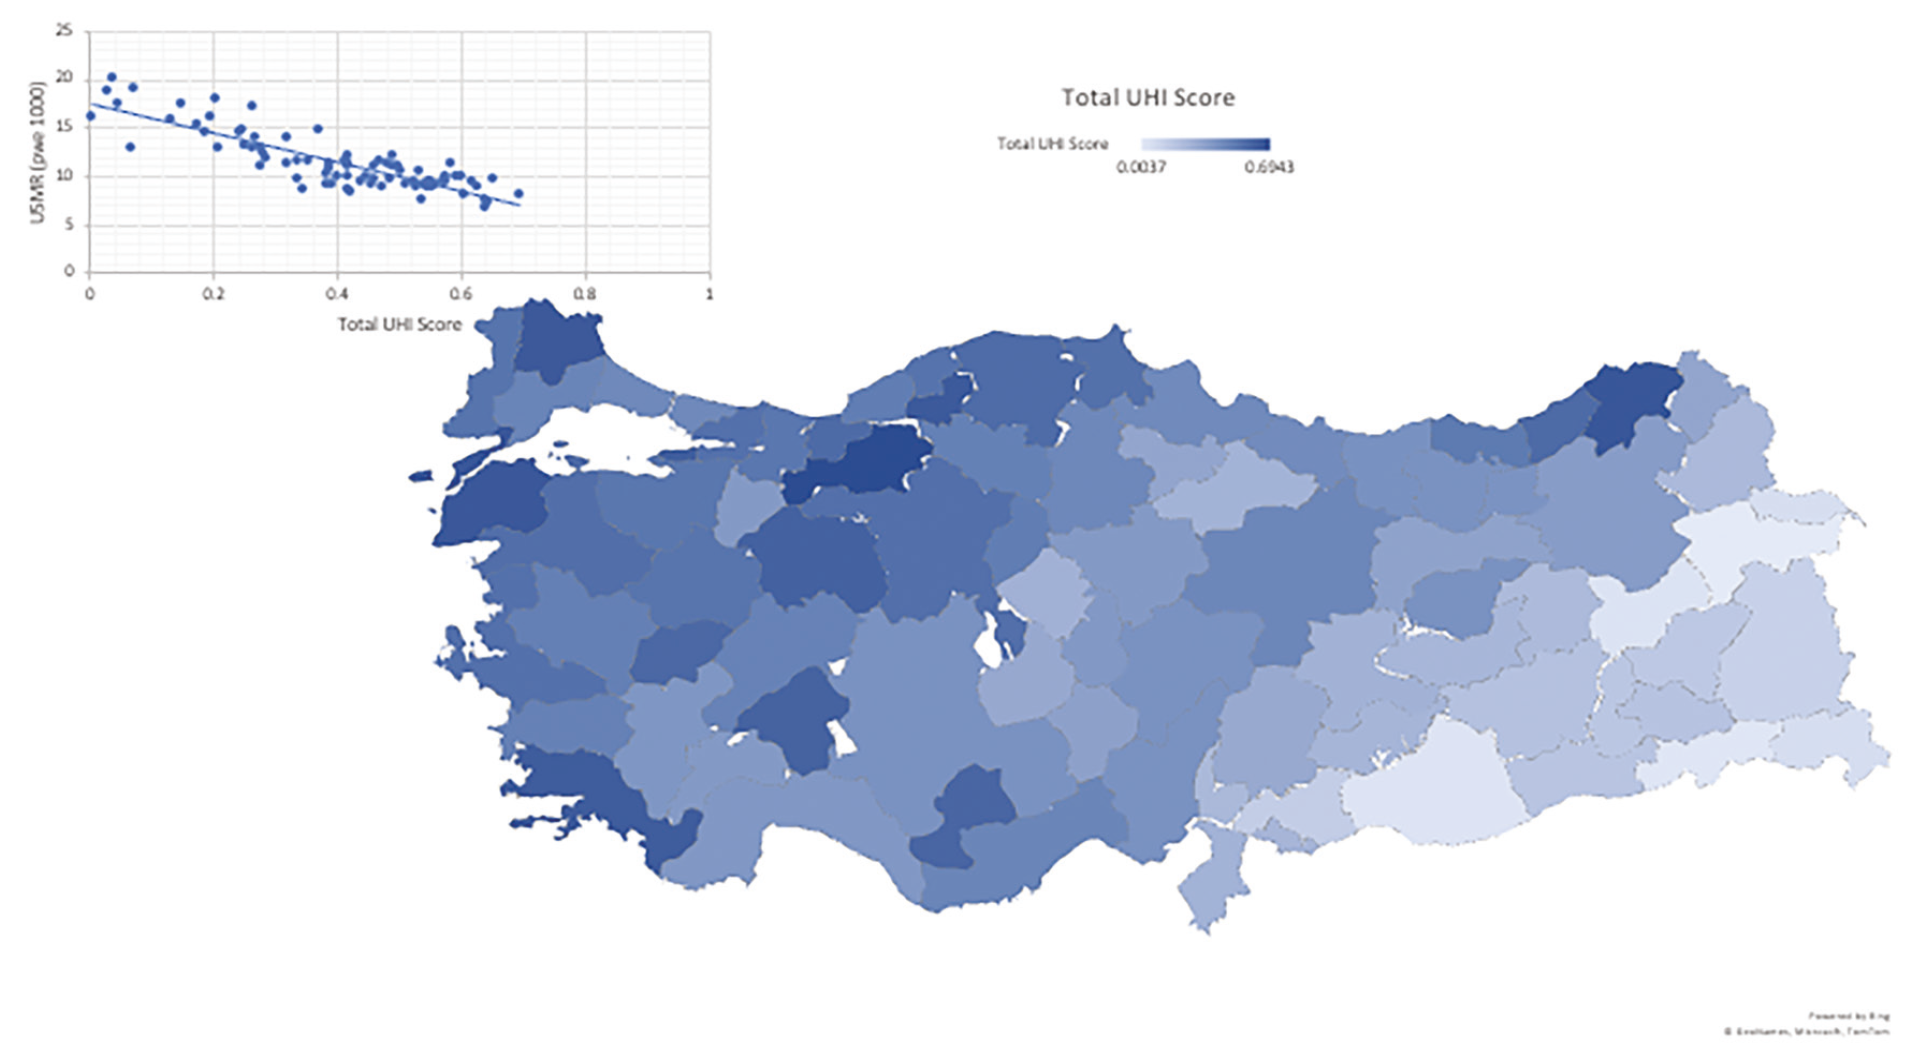
and visualize the total UHI score and the domains’ score across the provinces. The correlation of total UHI with U5MR presents a strong correlation as -0.855. As it can be seen from the map, there are inequalities between provinces in terms of UHI scores. Whereas provinces in Western parts of Türkiye tend to have higher UHI scores, provinces in Eastern and Southeastern Türkiye have lower UHI scores. Regarding the correlations of the domains, both economy and social-cultural indicators show strong correlation with U5MR (respectively -0.752 and -0.871) (, ,), while environmental conditions present moderate correlation (r= -0.562) and environmental health services is weakly correlated (r= -0.372).
UHI: Urban health index, U5MR: Under-five mortality rate
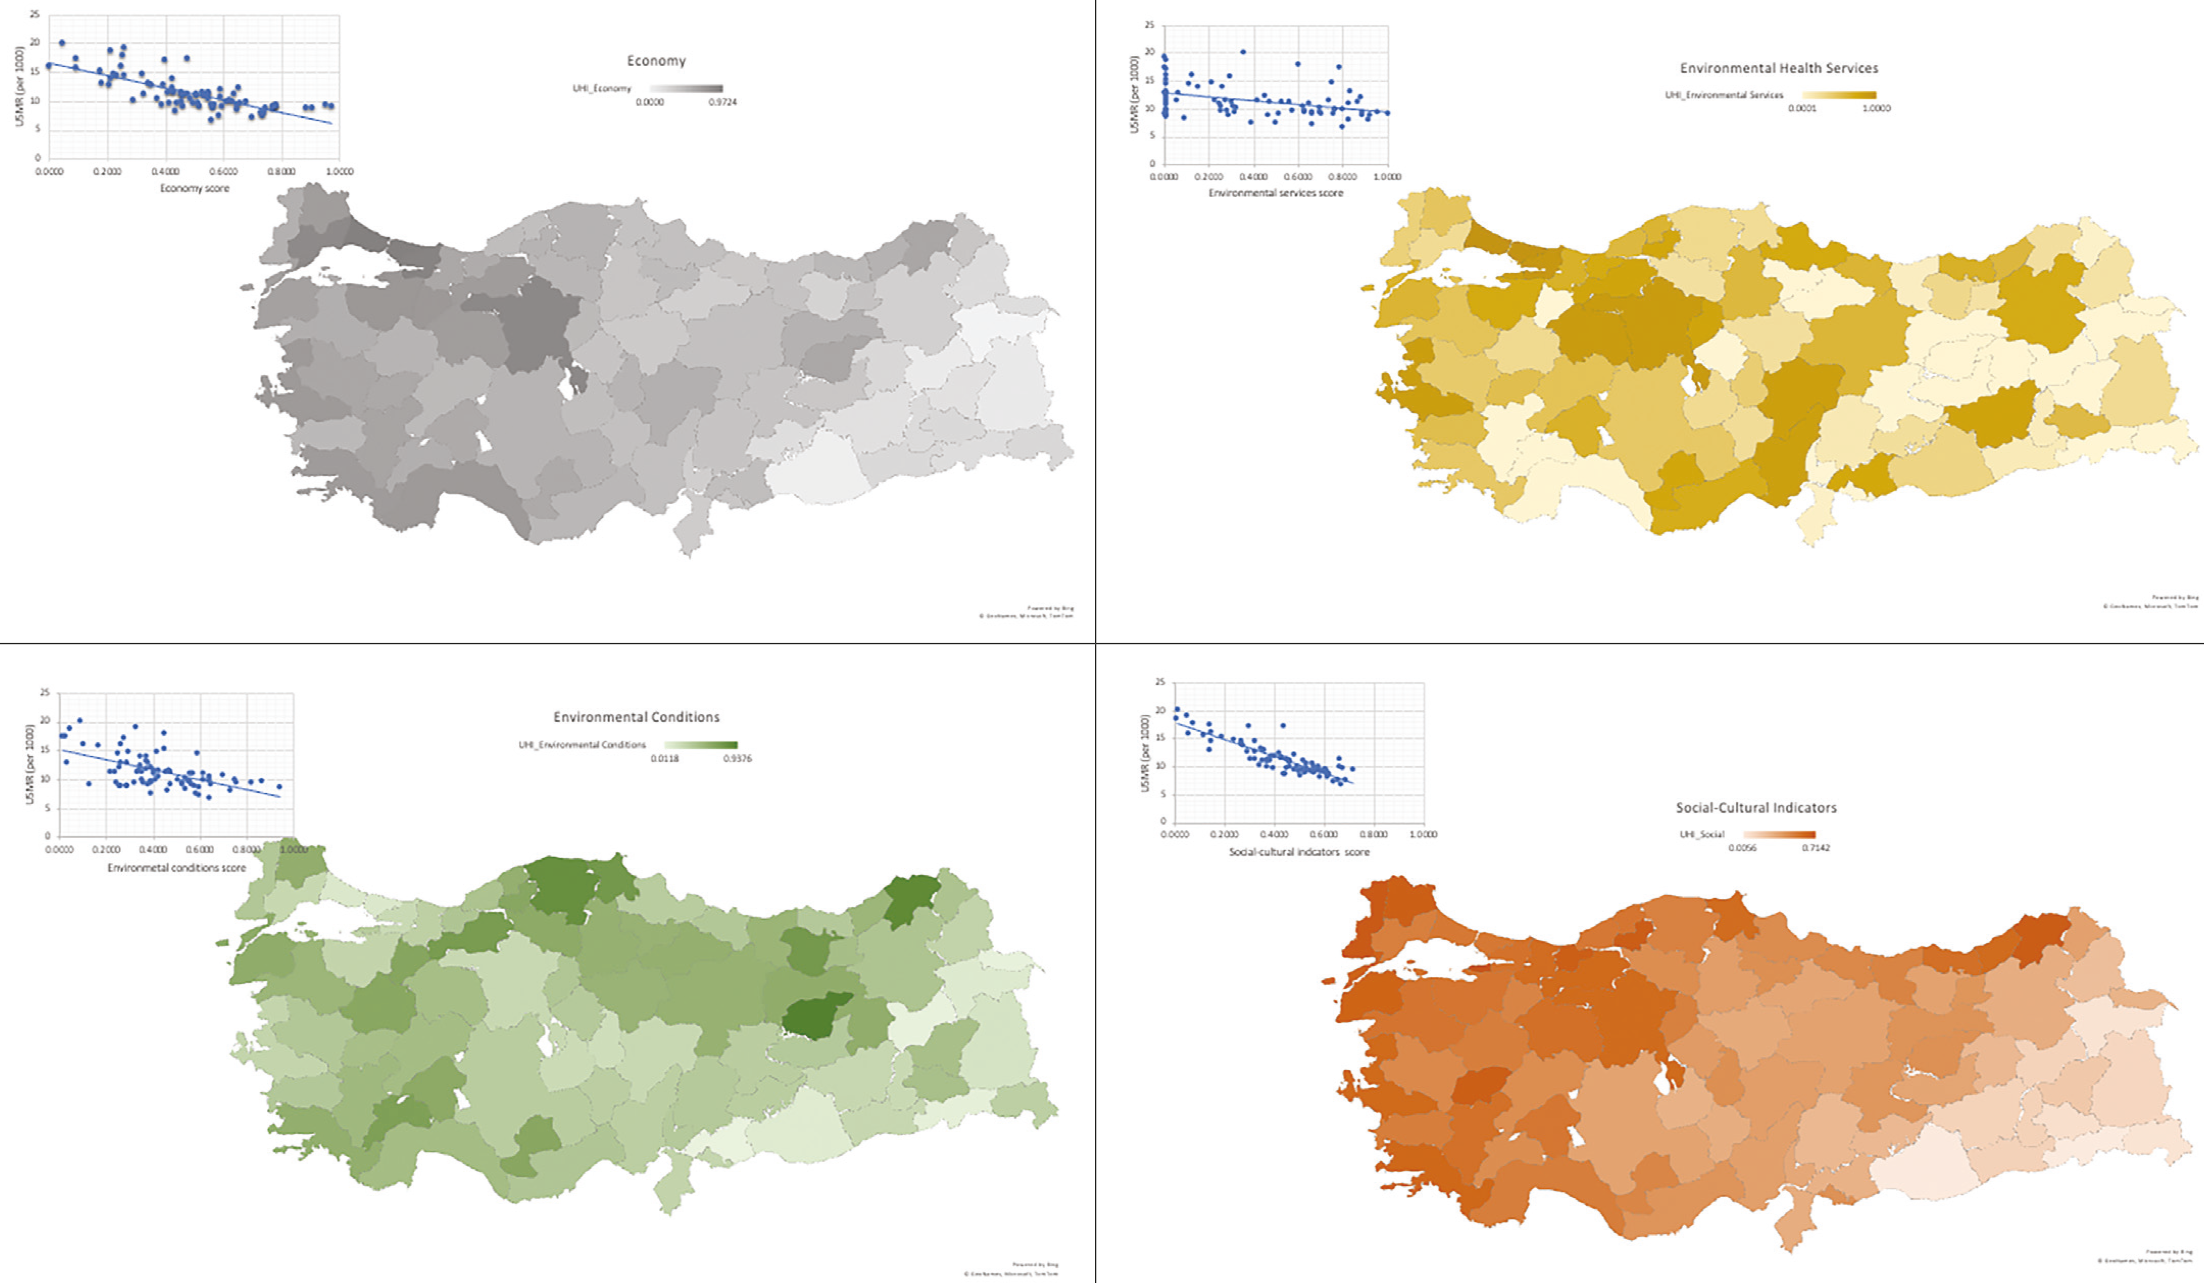
UHI: Urban health index, U5MR: Under-five mortality rate
DISCUSSION
In this study, we provide a list of indicators for assessing urban health at the province level as well as an UHI from a capability to be healthy perspective by taking into consideration the specific conditions and dynamics of Türkiye. This not only provides a tool for assessing urban characteristics associated with health but also allows us to compare and to follow up temporal change between the different provinces in Türkiye. Nevertheless, our index constitutes a first attempt at developing an accessible tool for monitoring urban health which can be utilized periodically in order to develop policies for improving the health and well-being of people in Türkiye. In this sense, our index not only allows us to make comparisons between different provinces in Türkiye but also serves a guideline for determining what kind of urban policies need to be implemented in order to ameliorate health conditions across Türkiye.
An understanding of health from a capabilities perspective is compatible with the vision laid out in 2030 Agenda for Sustainable Development in the sense that both approaches adopt a holistic view of urban health. Similar to the broader health-related sustainable development goals suggested by the United Nation, such as poverty eradication, equitable access to education, universal access to water and sanitation, full and decent employment; the indicators we suggest in our index also seek to provide a comprehensive approach to health. Such a conceptualization of urban health is crucial for upholding and achieving the right to health. We aimed to capture the relationship between several domains of health as a capability and different patterns of health. To this end, we used U5MR which is more related to urban health. However, it is mostly a methodological study that the correlation with U5MR was used to check the quality of the final index.
Although there are studies that focus on various aspects of urban health or that attempt to create UHIs for Türkiye, our study differs from them in various ways. First of all, we employ an ecological model which seeks to integrate social and biological reasoning- rather than one-dimensional models that solely focus on individual health behavior or biological factors. Secondly, due to our focus on social and environmental determinants of urban health, we utilize data which can be summarized as anything that impacts the health of urban residents in Türkiye, . To this end, we excluded health indicators on access to healthcare and health services. Lastly, we attempted to link our discussion on urban health to “the right to health” by adapting the “capability to be healthy” perspective. This perspective allowed us to focus on determinants of health in urban settings, rather than access to healthcare and health services, and allowed us to “shift the focus away from disease outcome toward urban exposure, namely, the characteristics of the urban context that influence health and well-being.”
Although developing indexes using statistical analysis has been criticized as a rationalist approach, UHIs are nevertheless “one growing form of evidence that public health practitioners use to inform urban policy-makers.” They allow us to better understand the dynamics behind cities as indicators used in creating indexes reflect factors affecting community health.
Based on the results, literacy and poverty indicators showed the strongest correlations with U5MR across provinces. While other economic indicators such as employment and income also demonstrated notable associations with population health, their correlations were comparatively weaker. A substantial body of literature supports the link between socioeconomic status (SES) and health outcomes at both macro and individual levels-. Education and income are widely recognized as core components of SES and are frequently used in measuring health gradients, . These factors are closely intertwined, as higher educational attainment often leads to better income and improved living condition.
Poverty, however, encompasses more than just financial deprivation; it also reflects limited opportunities for employment, constrained capabilities, and reduced empowerment and security. The poverty indicator used in this study, percentage of population under poverty line as defined by the Social Security Institution for universal health insurance eligibility captures only the financial dimension. Due to absence of province-level multidimensional poverty data, this measure served as a proxy for estimating the poverty. Notably, SSI data reported that 6.9% of the population was under the poverty line in 2019, while TurkStat estimated the figure at 14.4%. This discrepancy suggests that out proxy likely underestimates the actual level of poverty, potentially inflating the strength of the observed correlation with the health indicator.
Although numerous environmental indicators are recommended for inclusion in the UHI frameworks, this study incorporated only air pollution, green space availability, and crowdedness in microenvironments (households and schools). Air quality is routinely monitored at the provincial level through measurement stations; however, these stations are not always representative of the broader geographic area. Several province-level studies have reported significant correlations between air quality and premature mortality, .
The green space indicator used in this study, measured by forest area size, does not include parks and smaller recreational areas within urban settlements due to data limitations. This is a notable shortcoming, as the built environment is closely associated with both physical and mental health through mechanisms such as stress reduction, reduced exposure to environmental pollutants, and improved access to spaces that support physical activity and social engagement. Although indicators such as noise levels, drinking water quality, food hygiene, and environmental pollution (e.g., heavy metals) are relevant to urban health, data on these factors are not publicly accessible. As a result, the environmental dimension of the UHI was limited to three available indicators. However, even these are subject to limitations in data quality.
As noted in the Methods section, we separated environmental health services from the broader environmental domain because they primarily reflect municipal-level interventions. Services such as water hygiene, wastewater management, and solid waste disposal are well-established public health measures that contribute significantly to improved population health outcomes. However, because coverage rates for waste management, sewage systems, and water supply networks are uniformly high across provinces, these indicators were excluded from the analysis due to their limited sensitivity in capturing regional differences. However, the selected UHI indicators, the proportion of the population served by wastewater treatment and by drinking water treatment, show significant disparities across provinces, ranging from 0% to 99%. Though there is a weak correlation with the U5MR (r= -0.372), this wide variation may reflect structural and regional inequalities in infrastructure development, differences in municipal capacity, varying levels of urbanization, and uneven public investment across provinces. Furthermore, broader spatial disparity analyses indicate that infrastructure and limited access to safe water and sanitation services persist in some regions, particularly those less urbanized or economically disadvantaged, due to historical neglect or geographic and environmental constraints.
As stated in many international publications, strict gender norms and gender inequalities persist in Türkiye. Since TurkStat’s Family Structure Survey includes valuable gender-related indicators-such as decision-making around marriage, perceptions of appropriate marriage age for men and women, and types of marriage (civil or religious), these indicators are not available at the provincial level. A study analyzing the impact of gender inequality on population health across Organisation for Economic Co-operation and Development countries found that greater gender equality-measured through indicators such as education, political representation, and access to healthcare-s significantly associated with reductions in premature mortality, disability-adjusted life years, and years lived with disability, as well as improvements in overall life expectancy and health-adjusted life.
In developing the UHI, we initially planned to include indicators related to gender-based violence, such as number of women shelters per province. However, due to the lack of publicly available or complete data on women’s shelters across all provinces, these indicators could not be incorporated into the final index. As alternatives, we included indicators that reflect gender norms and women’s agency, specially the rate of women’s self-employment as a proxy for women’s entrepreneurship, and the crude divorce rate, both of which have been linked to shifting gender roles and autonomy in the literature-.
Indicators reflecting gender norms demonstrated a strong correlation with the health outcome. These measures serve as proxies for women’s economic participation, autonomy, and shifting social roles, all of which are recognized determinants of health. Research has shown that greater gender equity is associated with improved population health outcomes, including reductions in child mortality and increased life expectancy, , . Enhanced participation of women in the workforce and public life is often linked to stronger investments in health, education, and well-being at both household and community levels.
In developing the UHI, we also considered indicators related to leisure and recreation opportunities, recognizing their important role in promoting physical activity, mental well-being, and stress reduction. Access to recreational and social spaces has been shown to contribute positively to both physical and psychological health outcomes by fostering active lifestyles, social connectedness, and healthier coping mechanisms, . These spaces serve as key components of supportive urban environments, particularly in mitigating the health effects of urban stressors and sedentary behaviors.
Finally, the indicator included in the UHI framework to represent social networks, measured by the number of civil associations per population, showed a strong correlation with U5MR. This indicator serves as a proxy for social capital and community level social support, which are widely recognized as important social determinants of health. High levels of social capital are associated with improved health outcomes through mechanisms such as increased access to information and resources, collective efficacy, and emotional support-. In particular, stronger civic engagement and trust within communities have been linked to lower child mortality and better overall population health.
A more recent study developed a health index of provinces in Türkiye using health statistics published by the Ministry of Health in 2016. The indexes divided into four categories: health infrastructure, health personnel, health services, and health status. According to the study, majority of provinces in Eastern and Southeastern Türkiye rank demonstrate low performance across all indicators. Although this study differs from our UHI in that it focuses on the healthcare sector, it highlights disparities that exist at the regional and provincial level in Türkiye. As noted previously, we deliberately exclude the indicators on healthcare services because of our focus of the UHI. Although the role of healthcare services in determining population health is important, research consistently shows about the healthcare accounts for only 10% to 20% of the overall determinants of population health.
Study Limitations
A major challenge in developing the UHI was limited access to regularly collected, publicly available data. As noted by other researchers working on UHIs in Türkiye, , we found that reliable data is often unavailable. For example, we lacked access to provincial-level data on socially disadvantaged groups (e.g. children, women, LGBTI, and disabled people, water quality, food safety, gender equity (e.g. the number of women’s shelter and their capacity), electricity usage by sector, and income inequality (e.g. Gini coefficient). Including these would have allowed for a more holistic and capability-based index.
Another limitation is the use of the U5MR as the outcome variable, which strongly reflects access to healthcare access. Life expectancy might have been broader indicator, but internal migration patterns such as retirees moving to coastal or rural provinces distort province-level reliability. Despite its limitations, U5MR was selected as the most feasible proxy for population health.
Finally, because this study uses province-level data, it cannot capture intra-province disparities or neighborhood-level health inequalities.
CONCLUSION
The development of a multidimensional UHI offers a valuable framework for assessing the social and structural determinants of health at the provincial level. The strong correlations observed between health outcomes and indicators such as such as literacy, employment, and gender norms, and civic engagement underscore the need to broaden health policy beyond the healthcare sector to address underlying social and cultural factors.
To support effective use of the UHI, national and local governments should ensure that province-level and disaggregated data, particularly on vulnerable populations- are publicly accessible. Improving data availability and transparency is essential for advancing health equity and informed decision-making.
The UHI provides actionable insights that can guide evidence-based, inclusive policymaking to promote urban health, resilience, and social justice across Türkiye’s diverse provinces. Looking ahead, the collection and public dissemination of county-level data should be encouraged, as it would enable more granular assessments and further enhance the ability to address health disparities. Such efforts would make a meaningful contribution to improving population health and advancing health equity in Türkiye.
On the other hand, the component of the UHI highlight the key areas for enhancing population health through province-level policy. This study identifies potential local policy interventions, such as expanding leisure and recreation opportunities, promoting women empowerment, and improving built environment. Moreover, the findings underscore the importance of adopting a multidisciplinary, multidimensional, and participatory approach to urban health policymaking.
Footnotes
Ethics
Ethics Committee Approval: The data used in this study are anonymized, aggregate secondary data obtained from the Turkish Statistical Institute (TURKSTAT). Because the dataset is publicly accessible and contains no identifiable individual-level information, ethics committee approval was not required.
Informed Consent: This study is a retrospective study that used secondary data to construct an Urban health index.
Authorship Contributions
Concept: A.M., N.E., P.K., Design: A.M., N.E., Data Collection or Processing: N.E., Analysis or Interpretation: N.E., Writing: A.M., N.E., P.K.
Conflict of Interest: No conflict of interest was declared by the authors.
Financial Disclosure: This work was supported by “A Dense and Healthy City” project of Lund University, financed by FORMAS.
References
Galea S, Vlahov D. Urban health: evidence, challenges, and directions. Annu Rev Public Health. 2005;26:341-65.
World Bank. DataBank. Urban population - Turkiye. Available from: https://data.worldbank.org/indicator/SP.URB.TOTL?locations=TR
Corburn J, Cohen AK. Why we need urban health equity indicators: integrating science, policy, and community. PLoS Med. 2012;9:e1001285.
Pineo H, Zimmermann N, Cosgrave E, Aldridge RW, Acuto M, Rutter H. Promoting a healthy cities agenda through indicators: development of a global urban environment and health index. Cities Health. 2018;2:27-45.
Webster P, Sanderson D. Healthy Cities indicators--a suitable instrument to measure health? J Urban Health. 2013;90 Suppl 1:52-61.
Rothenberg R, Stauber C, Weaver S, Dai D, Prasad A, Kano M. Urban health indicators and indices--current status. BMC Public Health. 2015;15:494.
Prasad A, Gray CB, Ross A, Kano M. Metrics in urban health: current developments and future prospects. Annu Rev Public Health. 2016;37:113-33.
Venkatapuram S. Health Justice: An Argument from the Capabilities Approach. Malden: Polity. 2011.
Nussbaum M. Women’s capabilities and social justice. J Hum Dev. 2000;1:219-47.
Fukuda-Parr S. The metrics of human rights: complementarities of the human development and capabilities approach. J Hum Dev Capab. 2011;12:73-89.
Tengland PA. Health and capabilities: a conceptual clarification. Med Health Care Philos. 2020;23:25-33.
Pineo H, Glonti K, Rutter H, Zimmermann N, Wilkinson P, Davies M. Urban health indicator tools of the physical environment: a systematic review. J Urban Health. 2018;95:613-46.
World Health Organization, WHO centre for health development (Kobe, Japan). Urban heart: urban health equity assessment and response tool: user manual. [Internet]. Kobe, Japan: World Health Organization; 2010. Available from: https://iris.who.int/bitstream/handle/10665/79060/9789241500142_eng.pdf?sequence=1
Euro-URHIS final report [Internet]. Euro-URHIS: Europena urban hea;th indicators system. 2008. Available from: http://www.urhis.eu/media/mhs/internationalconferenceonurbanhealth/FINAL-REPORT.pdf
Pineo H. Healthy Planning and regeneration: innovations in community engagement, policy and monitoring [Internet]. London: building research establishment (BRE); 2017 Available from: https://files.bregroup.com/brebuzz/uploads/2017/08/Healthy-planning-and-regeneration-20170823-small.pdf
Kara Y. Kentsel sağlığın ölçümü: Türkiye için bir gösterge seti önerisi. Finans Politik ve Ekonomik Yorumlar Dergisi. 2013;50:53-63.
Sari Vİ, Kindap A. Türkiye’de kentsel yaşam kalitesi göstergelerinin analizi. J Turk Court Acc. 2018;108:39-72.
Badland H, Whitzman C, Lowe M, Davern M, Aye L, Butterworth I, Hes D, Giles-Corti B. Urban liveability: emerging lessons from Australia for exploring the potential for indicators to measure the social determinants of health. Soc Sci Med. 2014;111:64-73.
López Barreda R, Robertson-Preidler J, Bedregal García P. Health assessment and the capability approach. Glob Bioeth. 2019;30:19-27.
WHO. The urban health index: a handbook for its calculation and use. Kobe, Japan; 2014. Available from: https://www.who.int/publications/i/item/9789241507806?utm_source=chatgpt.com
Bland JM, Altman DG. Statistics notes: Cronbach’s alpha. BMJ. 1997;314:572.
Krieger N. Epidemiology and the people’s health: theory and context. Oxford University Press; 2011.
Barton H, Grant M. Urban planning for healthy cities a review of the progress of the European Healthy Cities Programme. 2011;90:129-41.
Corburn J. Urban place and health equity: critical ıssues and practices. Int J Environ Res Public Health. 2017;14:117.
Ompad DC, Galea S, Caiaffa WT, Vlahov D. Social determinants of the health of urban populations: methodologic considerations. J Urban Health. 2007;84:i42-53.
World Health Organization. our cities, our health, our future (Synopsis). 2008;1-26. Available from: https://cdn.who.int/media/docs/default-source/documents/social-determinants-of-health/urban-settings-knowledge-network-final-report-2007.pdf?utm_source=chatgpt.com
Vlahov D, Freudenberg N, Proietti F, Ompad D, Quinn A, Nandi V, et al. Urban as a determinant of health. J Urban Health. 2007;84:i16-26.
Pineo H, Zimmermann N, Davies M. Integrating health into the complex urban planning policy and decision-making context: a systems thinking analysis. Palgrave Commun. 2020;6:1–14.
Wilkinson R, Marmot M. The Solid Facts. Second. World Health Organization; 2003.16 p. Available from: https://iris.who.int/server/api/core/bitstreams/5d15a937-5558-4f72-8fbd-90381d6f8528/content
Hahn RA. What is a social determinant of health? Back to basics. J Public Health Res. 2021;10:2324.
Krieger N. Proximal, distal, and the politics of causation: what’s level got to do with it? Am J Public Health. 2008;98:221-30.
Mackenbach JP, Kunst AE, Cavelaars AE, Groenhof F, Geurts JJ. Socioeconomic inequalities in morbidity and mortality in western Europe. The EU Working Group on Socioeconomic Inequalities in Health. Lancet. 1997;349:1655-9.
World Health Organization. Handbook on health inequality monitoring: with a special focus on low- and middle-income countries [Internet]. Luxembourg; 2013. Available from: https://www.who.int/docs/default-source/gho-documents/health-equity/handbook-on-health-inequality-monitoring/handbook-on-health-inequality-monitoring.pdf
Kjellstrom T, Friel S, Dixon J, Corvalan C, Rehfuess E, Campbell-Lendrum D, et al. Urban environmental health hazards and health equity. J Urban Health. 2007;84:i86-97.
TURKSTAT. Press release. Income and living conditions survey, 2019. Available from: https://data.tuik.gov.tr/Bulten/Index?p=Income-and-Living-Conditions-Survey-2019-33820
Dark report 2022 [İnternet]. Clean air right platform; 2023. Available from: https://temizhavahakki.org/wp-content/uploads/2021/09/KaraRapor2021.pdf
Dark report 2024: Air pollution and health impacts [İnternet]. Clean air right platform; 2024. Available from: https://temizhavahakki.org/wp-content/uploads/2024/12/Kara-Rapor-2024_final.pdf
Andrews R, Beynon MJ. Configurational analysis of access to basic infrastructure services: evidence from Turkish provinces. Eur J Dev Res. 2019;31:1341-70.
Celebioglu F, Dall’erba S. Spatial disparities across the regions of Turkey: an exploratory spatial data analysis. Ann Reg Sci. 2010;45:379–400.
World Economic Forum. Global Gender Gap Report 2023 [Internet]. Geneva: World Economic Forum; 2023 Available from: https://www.weforum.org/publications/global-gender-gap-report-2023/
TURKSTAT. Turkey family structure survey, 2021 [İnternet]. Ankara: Turkish Statistical Institute; 2022. Available from: https://www.tuik.gov.tr/media/announcements/turkiye_aile_yapisi_ara%C5%9Ftirmasi_2021.pdf
Veas C, Crispi F, Cuadrado C. Association between gender inequality and population-level health outcomes: Panel data analysis of organization for Economic Co-operation and Development (OECD) countries. EClinicalMedicine. 2021;39:101051.
OECD. Closing the Gender Gap: Act Now [Internet]. OECD; 2012. Available from: https://www.oecd.org/en/publications/close-the-gender-gap-now_9789264179370-en.html
Buvinić M, Furst-Nichols R. Promoting Women’s Economic Empowerment: what works? World Bank Res Obs. 2016;31:59-101.
UN Women. Turning promises into action: gender equality in the 2030 agenda for sustainable development. 2018.
Maas J, Verheij RA, Groenewegen PP, de Vries S, Spreeuwenberg P. Green space, urbanity, and health: how strong is the relation? J Epidemiol Community Health. 2006;60:587-92.
WHO. Urban green spaces and health. Copenhagen: World Health Organization Regional Office for Europe; 2016.
Holt-Lunstad J. Social connection as a public health ıssue: the evidence and a systemic framework for prioritizing the “social” in social determinants of health. Annu Rev Public Health. 2022;43:193-213.
Social capital, social cohesion, and health. In: social epidemiology [Internet]. Oxford University Press; 2014 p. 290-19. Available from: https://academic.oup.com/book/24997/chapter/188990512
Szreter S, Woolcock M. Health by association? Social capital, social theory, and the political economy of public health. Int J Epidemiol. 2004;33:650-67.
Islam MK, Merlo J, Kawachi I, Lindström M, Gerdtham UG. Social capital and health: does egalitarianism matter? A literature review. Int J Equity Health. 2006;5:3.
Çağlar A, Keten ND. İllerin sağlık endeksi: bileşik endeks yaklaşımı ile bir deneme. Duzce Med J. 2019;21:42-53.
Magnan S. Social determinants of health 101 for health care: five plus five [Internet]. National Academy of Medicine; 2017. Available from: https://nam.edu/perspectives/social-determinants-of-health-101-for-health-care-five-plus-five/